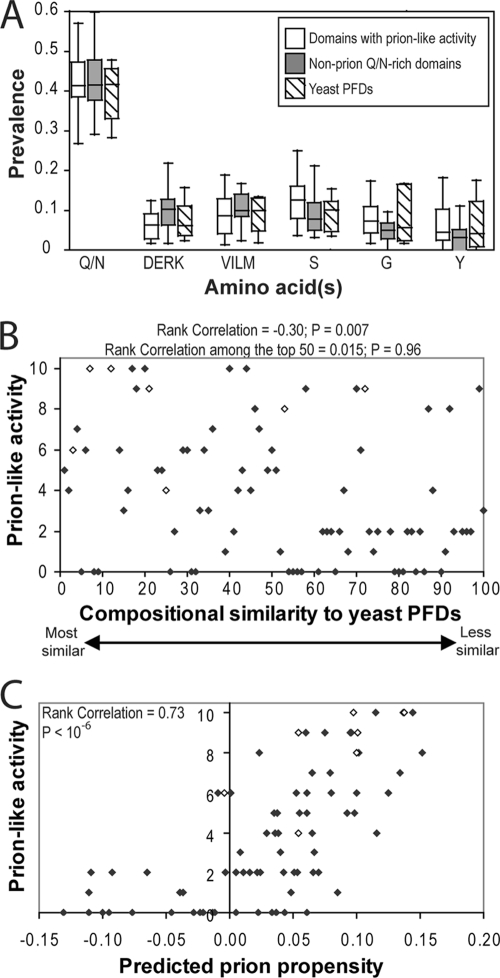
FIG. 8.
Ranking of Q/N-rich domains based on composition. (A) Box-and-whiskers plot of the prevalence of various amino acids among each of the domains shown by Alberti et al. (1) to have prion-like activity in four prion assays, the domains that lacked prion-like activity in all four prion assays, and the known PFDs. (B) Plot of compositional similarity to known PFDs versus prion-like activity. Alberti et al. (1) ranked the 100 domains with greatest compositional similarity to known yeast PFDs and then tested each domain for prion-like activity in four assays. Prion-like activity was scored on a scale from 0 to 10 (with 10 reflecting full prion-like activity in all four assays). Domains that were not testable in one or more assays are excluded. Known PFDs are indicated with open diamonds. Rank correlation and P values were calculated by Spearman's rank analysis. (C) Plot of predicted prion propensity versus prion-like activity. For each of the domains tested by Alberti et al., prion propensity was calculated as the 41 consecutive 41-amino-acid windows with maximum average predicted prion propensity that also had a negative FoldIndex order propensity.

