FIG. 6.
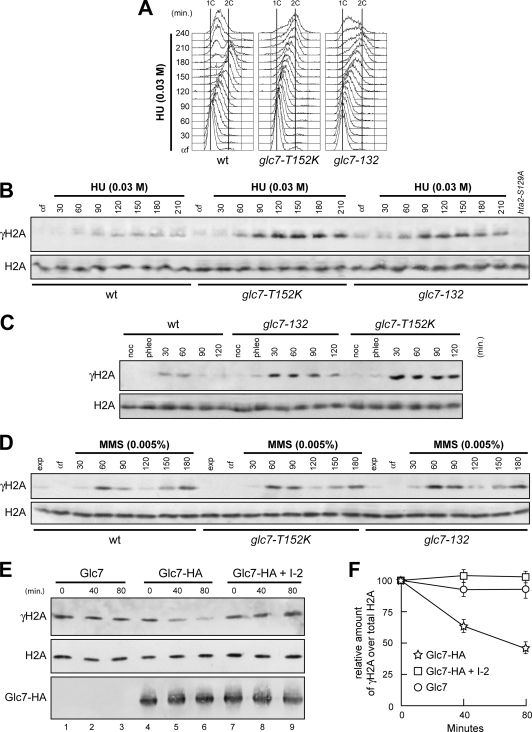
Glc7 regulates γH2A formation. (A and B) α-Factor-arrested (αf) wild-type (wt), glc7-T152K, and glc7-132 cells were released in YPD with 0.03 M HU. Aliquots of each culture were harvested at the indicated times after α-factor release to determine the DNA content by FACS (A) and to detect γH2A and H2A by Western blot analysis with anti-γH2A and anti-H2A antibodies, respectively (B). Specificity of the latter was checked with protein extracts from hta1Δ cells expressing the H2A-S129A variant (hta2-S129A), which were treated with 0.03 M HU for 120 min. (C) Cell cultures arrested in G2 with nocodazole (noc) were incubated with 5 μg/ml phleomycin. After 15 min (phleo), cells were transferred to medium lacking phleomycin but still containing nocodazole. (D) α-Factor-arrested (αf) cell cultures were released in YPD with 0.005% MMS. In panels C and D, aliquots of each culture were harvested at the indicated times after α-factor release to detect γH2A and H2A by Western blot analysis with anti-γH2A and anti-H2A antibodies, respectively. (E) Protein extracts from cells carrying either untagged GLC7 (Glc7) or fully functional HA-tagged GLC7 (Glc7-HA) at the GLC7 chromosomal locus were immunoprecipitated with anti-HA antibody. Immunoprecipitates were assayed for phosphatase activity toward purified histones at 30°C (lanes 1 to 6). The Glc7-HA immunoprecipitate was also preincubated for 15 min with inhibitor 2 (I-2) prior to phosphatase assay (lanes 7 to 9). At the indicated time points after histone addition, samples of each reaction mixture were subjected to Western blot analysis with anti-γH2A, anti-H2A, and anti-HA antibodies. (F) Densitometric analysis. Plotted values are the mean values ± standard deviations (SD) from three independent experiments as in panel E. The amount of γH2A was determined as the ratio between γH2A and total H2A band intensities.

