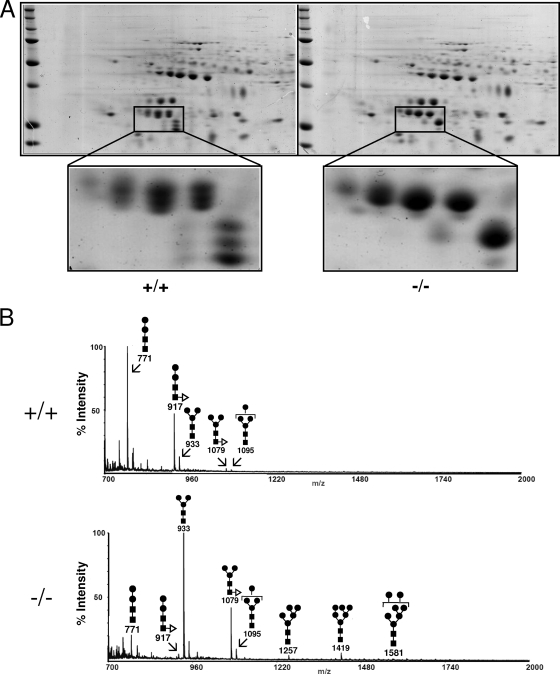
FIG. 5.
Isolation and characterization of N-linked oligosaccharides from mouse liver cathepsin B in a lysosome-enriched fraction (F2). (A) Three hundred micrograms of protein of F2 fractions from wild-type mice (+/+, left panel) and mice with α-mannosidosis (−/−, right panel) was separated by 2-D gel electrophoresis and visualized by Coomassie blue staining. Protein spots representing cathepsin B are drawn to a larger scale. (B) N-linked oligosaccharides from cathepsin B spots were released by in-gel PNGase F treatment, pooled, and analyzed by MALDI-TOF mass spectrometry. The symbols for the monosaccharides in the schematic drawing of the oligosaccharide are as follows: black squares represent N-acetylglucosamine residues, black circles represent mannose residues, and white triangles represent fucose residues. The numbers below the schematic structures indicate the detected masses of the appropriate oligosaccharides.

