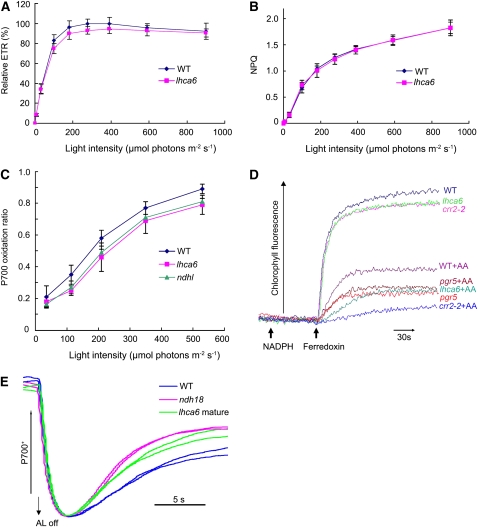
Figure 7.
In Vivo and in Vitro Analysis of Electron Transport Activity.
(A) The ETR is depicted relative to the maximum value of ΦPSII × light intensity in the wild type (100%).
(B) Dependence of NPQ of chlorophyll fluorescence on light intensity.
(C) Light intensity dependence of the P700 oxidation ratio (ΔA/ΔAmax) in ndhl, lhca6, and wild-type mature leaves.
(D) Increases in chlorophyll fluorescence by addition of NADPH (0.25 mM) and Fd (5 μM) under weak illumination (1.0 μmol photons m−2 s−1) were monitored in osmotically ruptured chloroplasts (20 μg chlorophyll/mL) of wild-type, lhca6, crr2-2, and pgr5 mature leaves. Ruptured chloroplasts were incubated with 10 μM Antimycin A before measurement. All values are mean ± sd (n = 5) in (A) to (C). This is a representative result of three experiments using thylakoid membranes independently isolated.
(E) Redox kinetics of P700 after termination of AL illumination (900 μmol photons m−2 s−1 for 2 min) under a background of FR. The leaves were illuminated by AL supplemented with FR to store electrons in the stromal pool. After termination of AL illumination, P700+ was transiently reduced by electrons from the PQ pool; thereafter, P700 was reoxidized by background FR. The redox kinetics of P700 was recorded. The P700+ levels were standardized by their maximum levels by exposing FR. The results using two independent plants for each genotype are overlapped.

