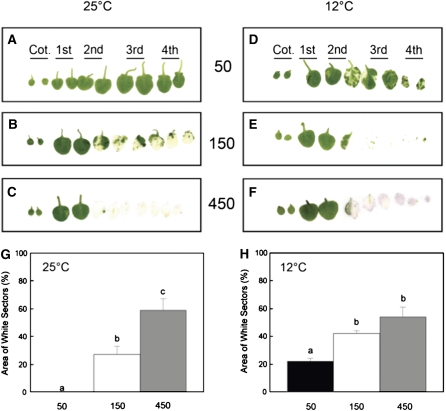
Figure 4.
Leaf Phenotype and Quantified Variegation of Excised Leaves.
(A) to (C) Leaf scans performed on im plants that were grown at 25°C and either 50, 150, or 450 μmol photons m−2 s−1. The leaf scans are arranged in consecutive order of development, from the cotyledons (Cot.) to the 4th leaf pair. All plants were grown under an 8/16-h day/night cycle.
(D) to (F) Leaf scans were performed as described above except im plants were grown at 12°C and either 50, 150, or 450 μmol photons m−2 s−1.
(G) and (H) Quantification of variegation from the scans for im leaves developed at 25°C (G) or 12°C (H) and either 50, 150, or 450 μmol photons m−2 s−1. Variegation was estimated as the percentage of white sectors as described in Methods. Data represent the mean ± se calculated from two independent experiments with three to six different plants per treatment. Letters represent statistically significant differences between means at the 95% confidence interval.

