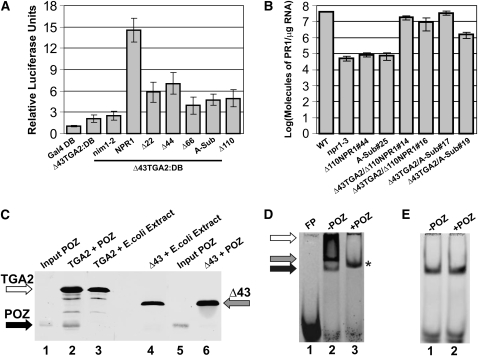
Figure 5.
The BTB/POZ Domain of NPR1 Interacts with the N terminus of TGA2 and Precludes Binding of the TGA2 Oligomer to DNA.
(A) Bar graph illustrating the transactivation properties of Δ43TGA2 fused to the Gal4 DB in complex with NPR1 and five NPR1 BTB/POZ domain mutants not fused to any domain. Results obtained with Gal4 DB alone (Gal4 DB) and Δ43TGA2:DB alone are also shown. Δ22, Δ44, Δ66, and Δ110 indicate NPR1 variants in which the first 22, 44, 66, or 110 amino acids have been deleted, while A-Sub refers to an NPR1 variant in which the core of the BTB/POZ domain has been substituted with Ala residues (see Rochon et al., 2006 for an in-depth rationale of these mutations). nim1-2 is an NPR1 mutant that does not interact with TGA2. Conditions were identical to those described in Figure 1C. Gray bars indicate a treatment with SA. Data are reported as relative luciferase units. Values consist of n = 25 samples and represent averages ± 1 sd. Every bar represents five bombardments repeated five times (n = 25).
(B) Bar diagram illustrating the abundance of PR-1 transcript present in wild-type, npr1-3, line 44 of an npr1-3 mutant plant expressing a variant of NPR1 lacking the first 110 amino acids (Δ110NPR1#44), and line 25 of an npr1-3 mutant plant expressing a variant of NPR1 mutated by Ala substitutions in the BTB/POZ domain (A-Sub#25). Δ110NPR1#44 was used as parent to express a TGA2 variant lacking the first 43 amino acids (Δ43TGA2). Two independent lines were tested for PR-1 expression (Δ43TGA2/Δ110NPR1#14 and Δ43TGA2/Δ110NPR1#16). These lines express Δ43TGA2 and Δ110NPR1 in the npr1-3 background. Similarly, A-Sub#25 was used as parent to express a TGA2 variant lacking the first 43 amino acids (Δ43TGA2). Two independent lines were tested for PR-1 expression (Δ43TGA2/A-Sub#17 and Δ43TGA2/A-Sub#19). These lines express Δ43TGA2 and a variant of NPR1, mutated by Ala substitutions in the BTB/POZ domain, in the npr1-3 background. Data for each bar represent averages containing two biological replicates, each composed of six plants. Errors are equal to ± 1 se. Note that the scale is logarithmic.
(C) Variation of the pull-down assay in which the solid phase was produced by linking biotinylated LS7 DNA to paramagnetic beads followed by binding of TGA2 (lanes 2 and 3) or Δ43TGA2 (lanes 4 and 6) to the DNA. The NPR1 BTB/POZ domain (lanes 2 and 6) or an E. coli extract (lanes 3 and 4) was incubated with the solid phase. Lanes 1 and 5 contain 20% of the amount of BTB/POZ domain used in lanes 2 and 6. All other lanes contain eluents from the solid phase. Proteins (TGA2, Δ43TGA2, and POZ) were revealed by immunoblots with an anti-His antibody. The black, gray, and white arrows indicate the position of the BTB/POZ domain of NPR1, Δ43TGA2, and TGA2, respectively.
(D) EMSA using recombinant TGA2 (lanes 2 and 3) together with the LS7 DNA as the probe. FP stands for free probe and refers to an experiment in which only DNA was present. POZ indicates that the BTB/POZ domain of NPR1 had been added (+) or not (−) to the EMSA reaction. The black, gray, and white arrows indicate the position of three distinct complexes. An asterisk denotes the position of a TGA2-BTB/POZ complex.
(E) EMSA identical to that in (D) with the exception that Δ43TGA2 replaced TGA2.

