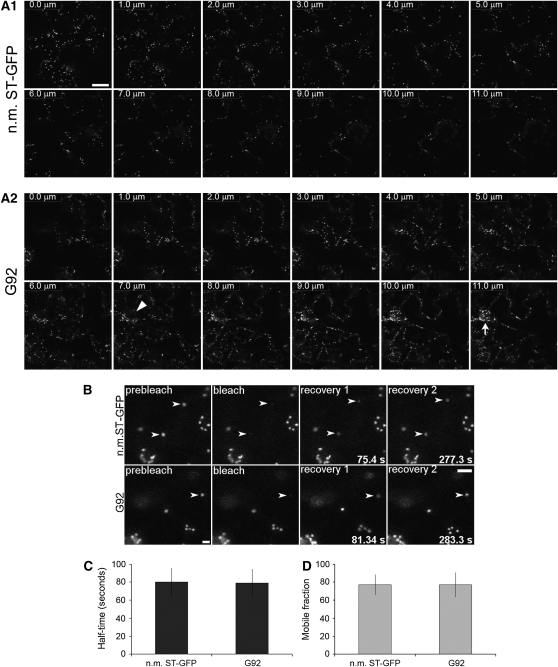
Figure 9.
Membrane Cargo Distribution and Protein Dynamics in the G92 Mutant.
(A) Sequential confocal optical sections (12 × 1 μm thickness) of cotyledon epidermal cells of nonmutagenized ST-GFP (n.m. ST-GFP; control; panel A1) and G92 seedlings (panel A2). Section 1 corresponds to the top section at the cell's cortex, and section 12 represents the innermost section. Consecutive slices are indicated by numbers at the top left corner. Note that there is no obvious redistribution of ST-GFP fluorescence outside the Golgi stacks (punctae) in the control. In the G92 sample, ST-GFP fluorescence is visible at the G92 structure (arrow); otherwise, it is contained within the Golgi stacks. A nuclear envelope proximal to the G92 structure is indicated by an arrowhead. See Supplemental Movie 3 online for a three-dimensional reconstruction of the optical slices. Bar = 20 μm.
(B) to (D) FRAP analyses on Golgi stacks at the cortex of cotyledon epidermal cells of nonmutagenized ST-GFP (n.m. ST-GFP) and G92 seedlings. Time of acquisition of individual frames after bleaching is indicated at the bottom right corner of frames (B). Bar = 5 μm. There was no significant difference (P < 0.05) in fluorescence recovery half times (C) and mobile fraction (%) between samples (D). Sample size (i.e., number of bleached Golgi stacks) = 13 for each sample. Error bars represent sd of the mean.

