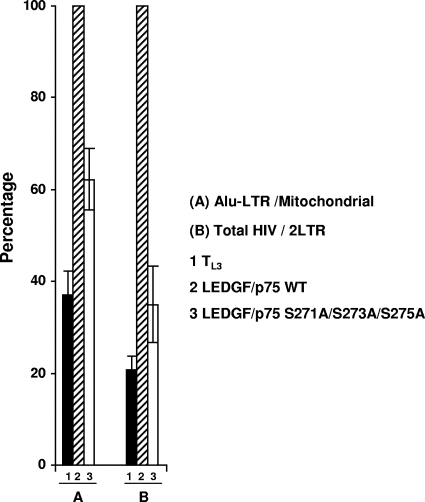
FIG. 4.
HIV-1 DNA integration in TL3 cells expressing the LEDGF/p75 S271A/S273A/S275A mutant. Results from two independent experiments using different viral preparations are represented. DNA products were quantified by real-time PCR 10 days after infection. Bars represent Alu-LTR DNA levels after normalization to mitochondrial DNA (A) and total HIV DNA levels after normalization to 2LTR circle DNA (B). Normalized levels of Alu-LTR and total HIV DNA detected in TL3 LEDGF/p75 WT cells were considered to be 100%.

