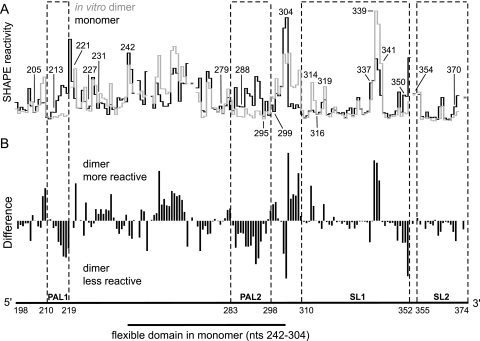
FIG. 5.
SHAPE reactivities for the RNA transcript in vitro dimer and monomer states. (A) Reactivity histograms for the in vitro dimer (gray) and monomer (black). Lines are interrupted for nucleotides that were not analyzed due to high background reactivity. (B) Difference plot calculated by subtracting the monomer intensities from those of the dimer. Positive and negative values indicate nucleotides that are more flexible in the dimer and the monomer, respectively.

