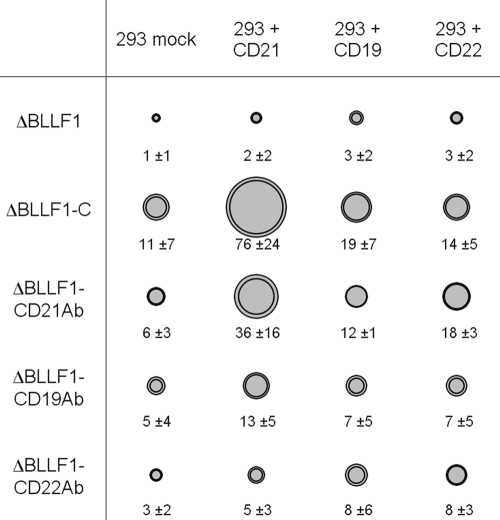
FIG. 4.
293 cell infection rates after transfection with CD19, CD21, or CD22 and infection with ΔBLLF1, ΔBLLF1-C, and the ΔBLLF1-Ab viruses. Infection rates are given as surface graph. The outer circle represents standard deviation. The number of positive cells per 5,000 infected cells is indicated.

