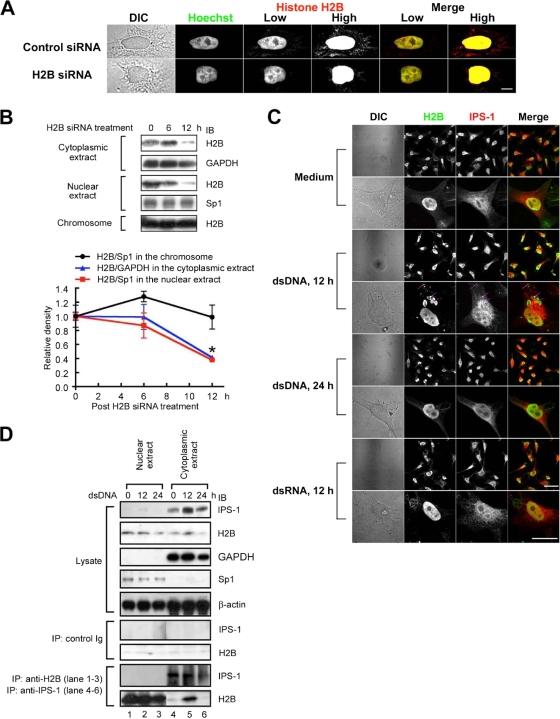
FIG. 3.
Extrachromosomal histone H2B interacts with IPS-1. (A) HeLa cells were transfected with control or H2B siRNA. Twelve hours after transfection, the cells were fixed, stained with Hoechst 33258 and anti-H2B Ab followed by Alexa 488-conjugated anti-mouse IgG Ab, and then examined under a confocal microscope. The pictures taken under low and high lighting conditions are shown as low and high, respectively. Bar, 20 μm. (B) The cells were collected 0, 6, or 12 h after H2B siRNA treatment, and the cell lysates were fractionated into the cytoplasmic extract, the nuclear extract, and the chromosome fraction. Each fraction was analyzed by immunoblotting using anti-H2B, anti-GAPDH, or anti-Sp1 Ab. The density of each H2B band was normalized to the density of the corresponding GAPDH band (the cytoplasmic extract) or Sp1 band (the nuclear extract and the chromosome fraction) and is shown on the graph (n = 3). (C) After stimulation with or without dsDNA or dsRNA for 12 or 24 h, HeLa cells were fixed and stained with anti-H2B Ab and anti-IPS-1 Ab followed by Alexa 488-conjugated anti-mouse IgG Ab and Alexa 555-conjugated anti-rabbit IgG Ab. The cells were then examined under a confocal microscope. Bar, 100 μm in low-magnification pictures (upper panels) and 50 μm in high-magnification pictures (lower panels). (D) HEK293 cells were collected 0, 12, or 24 h after dsDNA stimulation, and the cell lysates were fractionated into the cytoplasmic extract and nuclear extract. Each fraction was immunoprecipitated with control IgG, anti-H2B, or anti-IPS-1 Ab. The immune complexes were analyzed by immunobloting using either anti-H2B or anti-IPS-1 Ab. *, P < 0.05.

