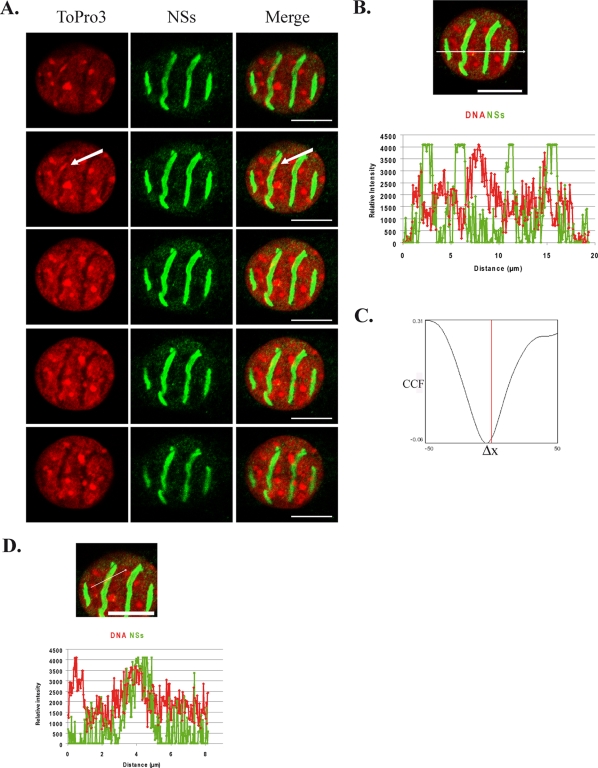
FIG. 1.
Cellular DNA is predominantly excluded from NSs filaments. Colocalization of cellular DNA with viral NSs filaments was analyzed by confocal microscopy in murine L929 cells infected by RVFV ZH548 strain at 16 h p.i. (A) Single confocal sections taken at 0.4-μm intervals through the z axis from the bottom (top row) to the top (bottom row) of the nucleus. Each row represents a single optical section of the same nucleus. Left panels correspond to cellular DNA counterstained with ToPro3 (red). Middle panels show NSs distribution detected with anti-NSs mouse polyclonal antibody (green). Merge images of ToPro3 and NSs are shown in right panels with colocalization displayed in yellow. An arrow indicates a dense DNA region colocalizing with NSs filaments. (B and C) Profile of the line scan quantifying the relative intensity of the two fluorochromes along the indicated line (B), as well as the corresponding CCF analysis (C). (D) Profile of the line scan through the region indicated by an arrow in panel A with ToPro3 displayed in red and NSs displayed in green. Bars, 10 μm.

