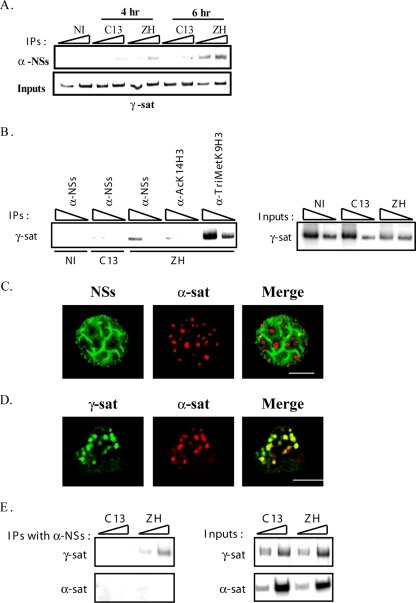
FIG. 3.
NSs filaments interact with pericentromeric γ-satellite sequences rather than with centromeric α-satellite sequences. (A) DNA immunoprecipitated (IP) (top) with anti-NSs antibody (α-NSs) and inputs corresponding to nonimmunoprecipitated genomic DNA (bottom), collected from murine L929 cells either not infected (NI) or 4 and 6 h after infection by pathogenic ZH548 (ZH) or nonpathogenic clone 13 (C13) strain was amplified with primers specific for pericentromeric γ-satellite DNA sequences (γ-sat). (B) DNA immunoprecipitated (IP) (left) with antibodies directed against NSs (α-NSs), the acetylated form of lysine 14 of histone H3 (α-AcK14H3), and the trimethylated form of lysine 9 of histone H3 (α-TriMetK9H3) and inputs corresponding to nonimmunoprecipitated genomic DNA (right), collected from murine L929 cells either not infected (NI) or 5 h after infection by pathogenic ZH548 (ZH) or nonpathogenic clone 13 (C13) strain, was amplified with primers specific for pericentromeric γ-satellite DNA sequences (γ-sat). (C) Single confocal section taken through the z axis of murine L929 cells infected by RVFV ZH548 strain displaying NSs immunostaining (left panel, green) combined with rhodamine-labeled centromeric minor α-satellite FISH (middle panel, red) and the corresponding merge image (right panel). (D) Single confocal section taken through the z axis of uninfected murine L929 cells displaying biotin-labeled pericentromeric γ-satellite FISH (left panel, green), rhodamine-labeled centromeric minor α-satellite FISH (middle panel, red), and the corresponding merge image (right panel). (E) DNA immunoprecipitated (IP) with anti-NSs antibody (α-NSs) (top) and inputs corresponding to nonimmunoprecipitated genomic DNA (bottom), collected from murine L929 cells 6 h p.i. by pathogenic ZH548 (ZH) or nonpathogenic clone 13 (C13) strain was amplified with primers specific for either pericentromeric γ-satellite (γ-sat) or centromeric minor α-satellite (α-sat) DNA sequences. In panels A, B, and E the triangles indicate increasing amounts of IPs or inputs amplified in pair of samples. The experiments whose results are shown in panel A were performed more than five times. The experiments whose results are shown in panels B and E were performed two times. Bars in panels C and D, 10 μm.

