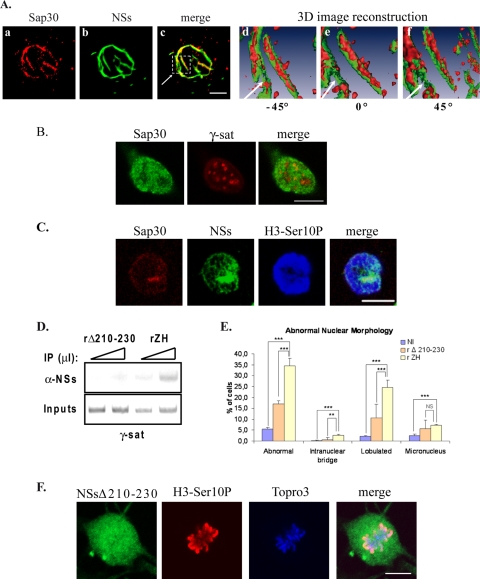
FIG. 6.
Interaction of NSs with SAP30 is required for NSs to target γ-satellite DNA sequences. (A) The distribution of SAP30 within NSs filaments was analyzed by using confocal microscopy (a to c) and three-dimensional (3D) image reconstruction (d to f) in murine L929 cells infected by RVFV ZH548 strain. In panels a to c, each row represents a single optical section through the z axis of an individual RVFV ZH548-infected murine fibroblastic L929 nucleus with SAP30 in red (a), NSs filament in green (b), and the corresponding merge image (c). The three-dimensional image reconstruction from confocal image stacks, one of which is shown in panels a to c, was performed by using Amira software. In panels d to f is shown the enlarged three-dimensional image of the region selected in panel c with the surface of SAP30 displayed in red and the surface of NSs displayed in green. (B) Single confocal section of uninfected murine L929 cells displaying SAP30 immunostaining (left panel, green) combined with rhodamine-labeled pericentromeric γ-satellite FISH (middle panel, red) and the corresponding merge image (right panel). (C) Single optical section of a ZH-infected mitotic L929 cell displaying immunostaining with anti-SAP30 in red, anti-NSs in green, anti-H3-Ser10P in blue, and the corresponding merge image (far right panel). (D) DNA immunoprecipitated (IP) (top) with anti-NSs antibody (α-NSs) and inputs corresponding to nonimmunoprecipitated genomic DNA (bottom), collected from murine L929 cells 6 h after infection by recombinant RVFV strain expressing either NSsΔ210-230 (rΔ210-230) or wild-type NSs (rZH) was amplified with primers specific for pericentromeric γ-satellite DNA sequences (γ-sat). Triangles indicate increasing amounts of IPs or inputs amplified in pair of samples. (E) The number of nuclei displaying abnormalities was quantified in uninfected cells (NI), as well as in cells infected by recombinant RVFV strains expressing either deleted NSsΔ210-230 (rΔ210-230) or wild-type NSs (rZH). The incidence of abnormal nuclei in rZH-infected cells was compared to NI or rΔ210-230-infected cells by using a chi-square test. **, P < 0.01; ***, P < 0.001; NS, not significant. (F) Single confocal sections taken through the z axis of a ZH-infected mitotic kidney sheep cell displaying immunostaining with anti-NSs in green, immunostaining with anti-H3-Ser10P in red, DNA counterstained with ToPro3 in blue, and the corresponding merge images. Bars, 10 μm.

