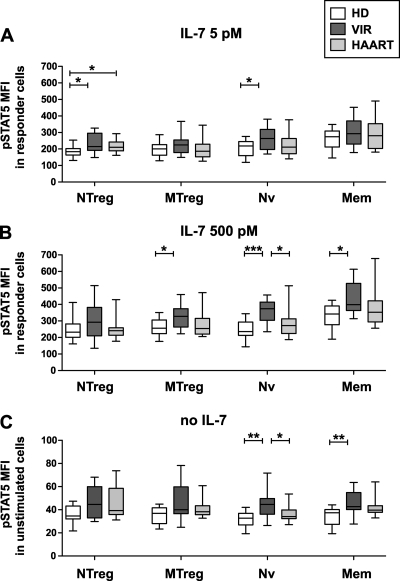
FIG. 6.
HIV infection induces STAT5 hyperactivation. PBMC from healthy donors (HD; n = 13), viremic patients (VIR; n = 12), and efficiently treated patients (HAART; n = 13) were stimulated with 5 pM IL-7 (A) or 500 pM IL-7 (B). The level of STAT5 phosphorylation in IL-7 responder cells was measured by the MFI of pSTAT5 within the population of pSTAT5+ cells for each of the four CD4+ T-cell subsets analyzed: NTreg, MTreg, Nv, and Mem. (C) Basal STAT5 phosphorylation levels are represented by the pSTAT5 MFI values observed in each CD4+ T-cell subset prior to cytokine stimulation. Boxes indicate median values and interquartile ranges; whiskers extend between minimum and maximum values. Statistically significant differences evaluated by the Mann-Whitney U test are indicated. *, P < 0.05; **, P < 0.01; ***, P < 0.001.

