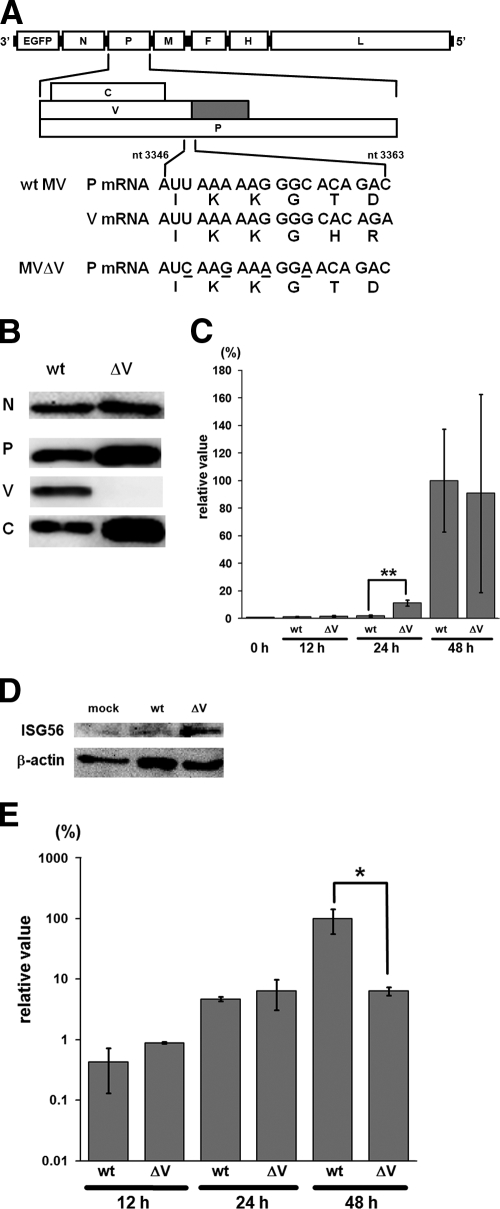
FIG. 3.
Generation and properties of the V protein-deficient MV (MVΔV). (A) Diagram of the MV genome indicating the locations of the introduced mutations to generate MVΔV. Underlines indicate the mutated nucleotides. The predicted amino acids are shown below the trinucleotide codons. nt, nucleotide. (B) Protein synthesis in MV-infected cells. B95a cells were infected with wt MV or MVΔV at an MOI of 0.01. At 36 h after infection, viral proteins (N, P, V, and C) in the infected cells were detected by Western blot analysis. (C) IFN-β mRNA levels in H358 cells infected with wt MV or MVΔV at an MOI of 0.5. At 12, 24, and 48 h after infection, total RNA was extracted from the MV-infected cells, and the IFN-β mRNA levels were quantified by RT-qPCR. The data were normalized by the β-actin mRNA levels, and the mean value in wt MV-infected cells at 48 h after infection was set to 100%. The data represent the means ± the standard deviations of triplicate samples. The IFN-β mRNA level in uninfected cells is also shown (0 h). **, P < 0.01 (significant difference based on a t test). (D) Induction of ISG56 in MV-infected cells. H358 cells were mock infected or infected with wt MV or MVΔV at an MOI of 0.5. At 24 h after infection, the ISG56 levels in the infected cells were detected by Western blot analysis. β-Actin was analyzed as an internal control. (E) N mRNA levels in H358 cells infected with wt MV or MVΔV at an MOI of 0.5. At 12, 24, and 48 h after infection, total RNA was extracted from MV-infected cells, and the N mRNA levels were quantified by RT-qPCR. The data were normalized by the β-actin mRNA levels, and the mean value in wt MV-infected cells at 48 h after infection was set to 100%. *, P < 0.05 (significant difference based on a t test).

