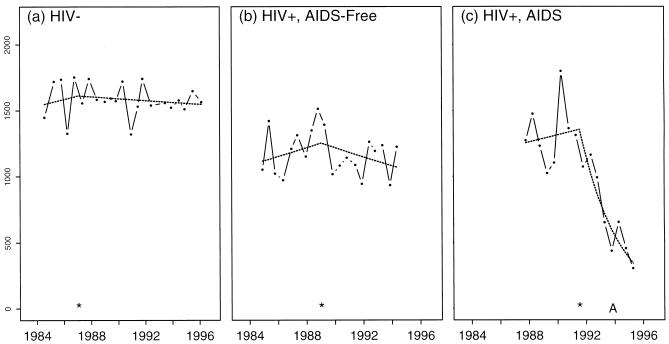
Figure 4.
Representative T-cell lymphocyte counts (solid lines and points) for three men who were: (a) HIV−, (b) HIV+ without AIDS onset, and (c) HIV+ with AIDS onset. The best-fit segmented regression model is denoted by the dashed line with the ∗ denoting the estimated IP. “A” indicates the date of onset of clinical AIDS. The fitted regression lines are curved because of the linear structure used to model the log10 transformed values, and we have exponentiated the values to plot the data and the regression estimates in the original scale (cells per mm3).

