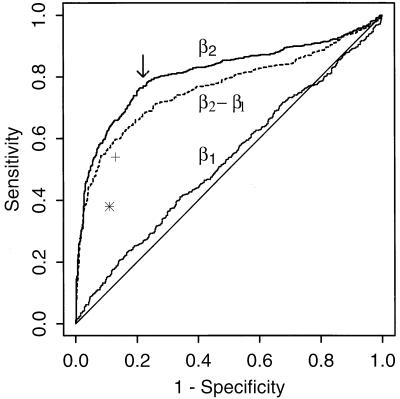
Figure 5.
ROC curves (sensitivity vs. 1 − specificity) when distinguishing AIDS and AIDS-free men (SC and SP groups combined) using three different criteria: CD3+ slope before IP (β̂i1), CD3+ slope after IP (β̂i2), and the change in log10(CD3+) slopes from before IP to after IP (β̂i2 − β̂i1). The arrow indicates the point of maximal sensitivity and specificity. ∗ and + denote the characteristics when distinguishing individuals by using the statistical criteria (i.e., classification based on F-statistics) for all individuals and those with 15 or more visits, respectively.

