FIG. 3.
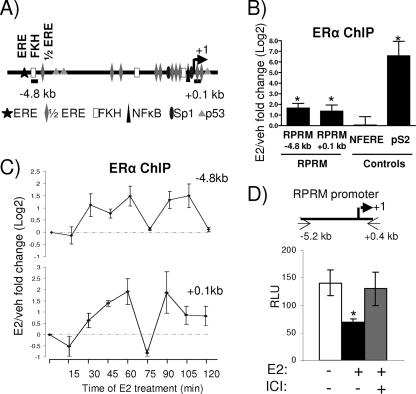
ERα is recruited to an E2-responsive RPRM promoter. (A) Simplified model showing consensus sites and positions of primers used in subsequent ChIP assays in the RPRM gene. (B) ChIP assays for ERα in MCF7 cells after treatment with vehicle (veh) or E2 for 45 min. The recruitment of ERα to different positions in the RPRM gene as well as to the negative control region, NFERE, and the pS2 promoter is shown. Data are represented as the log2 E2 fold change compared to vehicle control and are an average of four independent experiments ± SEM. A t test analysis was performed in which E2 treatment groups were compared to the vehicle group. *, P < 0.05 (C) ChIP assays for ERα in MCF7 cells after treatment with E2 for various time points, as indicated. The recruitment of ERα to different positions in the RPRM gene is shown. Data are represented as the log2 E2 fold change compared to vehicle control and are an average of two independent experiments. (D) MCF7 cells were transfected with the RPRM promoter and treated with vehicle, E2, or ICI for 24 h, following which luciferease reporter assays were performed. The data represent relative luminescence units (RLU) that are an average of three replicates ± SD and are representative of at least five independent experiments. *, P < 0.05, t test.

