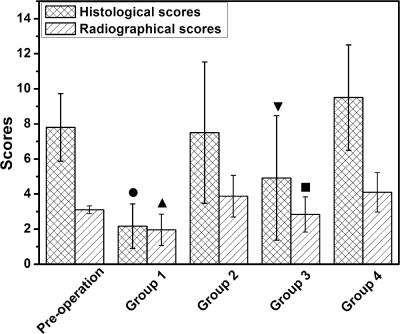
FIG. 5.
Histological and radiographical scoring showed that significantly lower scores occurred in groups 1 (TCS pellets) and 3 (i.v. teicoplanin) than in control groups, as well as between group 1 and 3 (means ± standard deviations). The filled circle and filled upright triangle indicate significant differences (P < 0.05) compared with preoperative scores and scores in groups 2, 3, and 4. The filled inverted triangle and filled square indicate differences (P < 0.05) compared with groups 2 and 4.

