Abstract
The objective of this work was to evaluate the lesion detection performance of four fully-3D positron emission tomography (PET) reconstruction schemes using experimentally acquired data. A multi-compartment anthropomorphic phantom was set up to mimic whole-body 18F-fluorodeoxyglucose (FDG) cancer imaging and scanned 12 times in 3D mode, obtaining count levels typical of noisy clinical scans. Eight of the scans had 26 68Ge “shell-less” lesions (6, 8-, 10-, 12-, 16-mm diameter) placed throughout the phantom with various target:background ratios. This provided lesion-present and lesion-absent datasets with known truth appropriate for evaluating lesion detectability by localization receiver operating characteristic (LROC) methods. Four reconstruction schemes were studied: 1) Fourier rebinning (FORE) followed by 2D attenuation-weighted ordered-subsets expectation-maximization, 2) fully-3D AW-OSEM, 3) fully-3D ordinary-Poisson line-of-response (LOR-)OSEM; and 4) fully-3D LOR-OSEM with an accurate point-spread function (PSF) model. Two forms of LROC analysis were performed. First, a channelized nonprewhitened (CNPW) observer was used to optimize processing parameters (number of iterations, post-reconstruction filter) for the human observer study. Human observers then rated each image and selected the most-likely lesion location. The area under the LROC curve (ALROC) and the probability of correct localization were used as figures-of-merit. The results of the human observer study found no statistically significant difference between FORE and AW-OSEM3D (ALROC = 0.41 and 0.36, respectively), an increase in lesion detection performance for LOR-OSEM3D (ALROC = 0.45, p = 0.076), and additional improvement with the use of the PSF model (ALROC = 0.55, p = 0.024). The numerical CNPW observer provided the same rankings among algorithms, but obtained different values of ALROC. These results show improved lesion detection performance for the reconstruction algorithms with more sophisticated statistical and imaging models as compared to the previous-generation algorithms.
Index Terms: Fully-3D PET, lesion detection, localization receiver operating characteristic (LROC), observer study, positron emission tomography (PET)
I. Introduction
Reconstruction of fully-3D positron emission tomography (PET) data has undergone a number of algorithmic advances in recent years. Most modern PET tomographs can be operated in fully-3D mode without interslice septa, providing a high-sensitivity acquisition mode. One landmark reconstruction approach for such fully-3D data is the use of Fourier rebinning (FORE) ([1], [2]), followed by 2D iterative reconstruction with, e.g., the ordered-subsets expectation-maximization (OSEM) algorithm [3], [4]. FORE provides a means for reducing the computationally-expensive fully-3D reconstruction problem to a more tractable 2D problem without axial blurring associated with the rebinning process, and has become a widely used method for reconstructing fully-3D PET data. One shortcoming of FORE is that it alters the statistical nature of the projection data—since the rebinned data are no longer Poisson distributed, reconstruction of these data does not gain the full statistical benefit of maximum-likelihood (ML) reconstruction algorithms.
ML estimators provide the unbiased solution with minimum variance, and reconstruction algorithms based on ML estimation theory have received significant attention for PET reconstruction (e.g., [5], [6]). Since it is desirable to preserve the Poisson statistics of the measurement when using ML-based algorithms, reconstruction of fully-3D PET data without first rebinning into multi-slice 2D data is of great interest. A number of different approaches to statistical fully-3D PET reconstruction have been studied in various configurations. One approach has been to preprocess the measured projection data in the (historically) usual manner, obtaining evenly-spaced projection elements representing (approximate) line-integrals of the source activity distribution. Such preprocessing includes corrections for detector deadtime, uniformity, scatter, randoms, and attenuation. The processed sinograms are then reconstructed using the fully-3D maximum-likelihood expectation maximization (MLEM) or OSEM algorithms. However, the preprocessing steps spoil the Poisson statistics so that the full benefit of ML is not achieved. One significant advance in this area has been to move the attenuation correction from a preprocessing step into the reconstruction processor; since attenuation represents the correction of the largest magnitude, this helps keep the data being reconstructed much more “Poisson-like.” This approach is commonly called attenuation-weighted (AW-)OSEM [7], [8].
Further development of statistical iterative reconstruction methods has led to “LOR-based” algorithms which reconstruct directly from the raw coincidence line-of-response (LOR) data without any preprocessing [9]–[13]. All corrections are explicitly moved into the reconstruction itself. The Poisson statistics of the measurement are thus preserved, and the full benefit of ML estimation is realized. These are sometimes referred to as “Ordinary Poisson” methods. One key component of LOR-based algorithms is that the so-called geometric or “arc” correction, which transforms between the uneven spacing of the raw coincidence lines and the evenly-spaced image voxels, must be modeled during the reconstruction. This can be done by either using an explicit reconstruction system matrix, or by using a projector-backprojector pair which directly maps from the image voxels to the raw coincidence LORs (and vice versa) [13]. These LOR-based algorithms begin to approach true ML reconstruction; however, exact ML reconstruction requires that the full physics of the imaging process be accurately and precisely modeled. One significant component of such modeling is that the point spread function (PSF) is broad (generally much broader than a single LOR), asymmetrical, and spatially-variant. Modeling the spatially-variant PSF during fully-3D iterative reconstruction thus has the potential for improving the reconstruction, especially in terms of the spatial resolution, and may also impact the noise qualities of the final image. Methods for modeling the spatially-variant PSF during iterative 3D PET reconstruction are under investigation by several groups [14], [15].
Each of the reconstruction advances just reviewed has been studied in terms of its effect upon image characteristics such as spatial resolution, contrast, and noise measures. While such analysis is directly related to performance for quantitation tasks, the impact of these reconstruction advances upon lesion detection tasks is less easily determined. Visual assessment of phantom and patient images would seem to suggest overall improvements of image quality for the more sophisticated algorithms, though such assessment is subjective and does not necessarily translate to improvements in the lesion-detection task.
The primary objective of this work was to objectively evaluate and rank the lesion-detection performance of four fully-3D PET reconstruction schemes: 1) FORE-OSEM2D; 2) AW-OSEM3D; 3) LOR-OSEM3D; and 4) LOR-OSEM3D with PSF model. An anthropomorphic phantom designed to mimic whole-body 18F-fluorodeoxyglucose (FDG) cancer imaging was used, providing data suitable for assessment of lesion-detection performance by localization receiver operating characteristic (LROC) techniques. A method for applying the channelized nonprewhitened (CNPW) observer [16]–[18] to such experimental data was developed, and this observer was used to select the number of iterations and postreconstruction filter for each algorithm. Human observers then read the subset of images with optimized reconstruction parameters to complete the assessment of relative lesion-detection performance. The following sections present the experimental methods, analysis methods, results, and conclusions of the study.
II. Methods
A. Phantom Experiments
The anthropomorphic whole-body phantom of [19] was modified and used for the current study. The phantom, shown in Fig. 1, consists of a 3D Hoffman brain phantom (Data Spectrum Corporation, Hillsborough, NC), a thorax phantom containing liver and lung compartments plus realistic rib cage and spine attenuating structures embedded in the phantom wall (Radiology Support Devices, Inc., Long Beach, CA), and a 31.8 × 23.4 × 20.0-cm elliptical cylinder (Data Spectrum) with a plastic bottle representing the pelvis and bladder. The cardiac insert and central mounting assembly of the thorax were removed, and the lungs were modified to be self-filling by perforating the lung walls and using nylon mesh bags to hold the Styrofoam beads in place. Activity concentration in the lungs with this setup was measured to average 0.37 times that of the soft tissue background, and lung density averaged 0.40 g/cc.
Fig. 1.
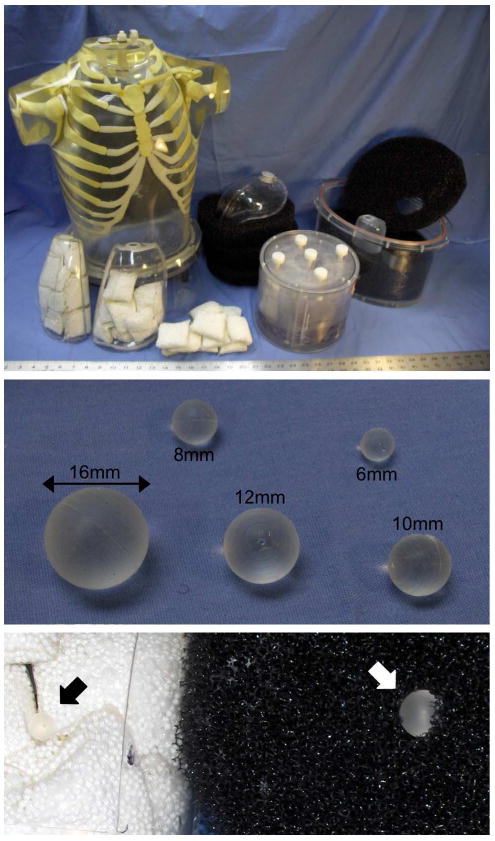
The whole-body lesion detection phantom consisted of a brain phantom, thorax with liver and lung compartments, and elliptical pelvis with bladder compartment. The lungs were filled with nylon mesh bags of Styrofoam beads, and the body and pelvis compartments were filled with a low water resistance open cell foam. 68Ge-infused silicone lesions were mounted in the mediastinum, lungs, abdomen, liver, and pelvis compartments. The close-up at the bottom shows an 8-mm lesion placed in the lung (black arrow), and a 12-mm lesion inserted into the open-cell foam of the body compartment (white arrow).
Two new modifications to the whole-body lesion detection phantom have been implemented since [19]. The previous version of the phantom used 22Na-filled epoxy lesions encapsulated by plastic shells; however, the ∼l-mm-thick plastic walls displaced the background activity immediately surrounding the lesions—potentially causing a visible structure on the image and affecting both lesion contrast recovery and detectability. This study used “shell-less” lesions consisting of 68Ge-infused silicone gel without an outer plastic shell as described in [20].
The second main modification was that a low water resistance open cell foam (5 ppi filter foam; New England Foam Products LLC) was used to fill the soft tissue compartments of the thorax and pelvis. This foam served two purposes. First, it provided a means for mounting the lesions wherever desired by cutting a slit in the foam and inserting the lesion. Second, the foam displaced approximately 2%–3% of the background water volume and created numerous small (∼l–2 mm) air bubbles distributed throughout the background when filled with water. This provided the slightly nonuniform “lumpy” background shown in Fig. 2—more representative of in vivo tissue than a homogenous water-filled compartment. The lesions in the liver were mounted on small diameter monofilament line (piercing the lesions with a hypodermic needle in order to feed the line through), and the lesions in the lungs were packed tightly between the nylon bead bags.
Fig. 2.
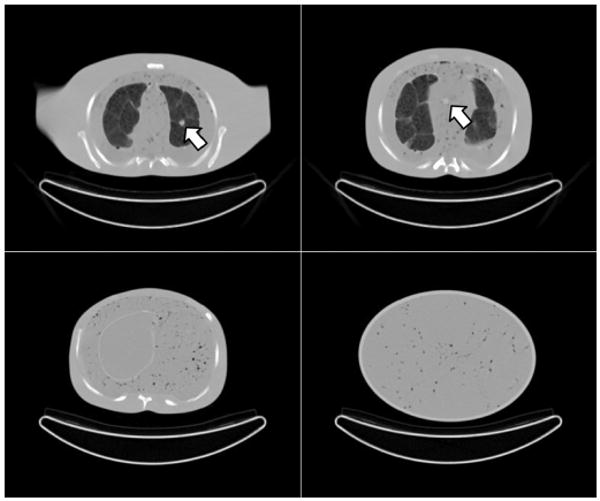
Example CT images of the phantom chest (top row), abdomen (bottom left), and pelvis (bottom right). The chest images show a lesion in the left lung (left) and mediastinum (right). The structure in the lungs arises from the packing of Styrofoam beads in nylon bags, and the structure in the mediastinum, abdomen, and pelvis body compartments arises from small air bubbles suspended in the open-cell foam material.
The phantom was scanned repeatedly over three days on a fully-3D TruePoint Biograph with TrueV PET/CT scanner (Siemens Medical Solutions), where the CT scans were used for both attenuation correction and to aid in determining the true lesion locations (but were not provided to the readers for the observer studies). On each day, the phantom was filled with 18F in water with activity concentrations in each compartment based on twelve oncologic FDG PET scans performed at our institution: soft tissue 1:1, liver 1.8:1, lungs (avg.) 0.37:1, brain (avg.) 6.0:1, and bladder 15:1. The total activity present at the start of scanning on each day was 4.88, 6.00, and 5.46 mCi. Days 1 and 2 had 26 68Ge lesions distributed throughout the lungs, mediastinum, liver, abdomen, and pelvis compartments; and the lesions were removed for the scans on Day 3. The activity concentration in each lesion was 0.345 μCi/cc, and diameters of 6, 8, 10, 12, and 16 mm were used. The lesions were placed in different locations for Day 1 and Day 2, as shown in Fig. 3, taking care to place lesions in different transverse slices as much as possible to minimize axial lesion overlap. Four whole-body scans were acquired each day over six bed positions at 4 min per bed, with each scan starting at 55 min intervals. This provided a total of eight lesion-present scans and four lesion-absent scans, where each lesion-present scan had varying lesion target:background ratios as the 18F background decayed (T1/2 = 109.77 min.) but the 68Ge lesions remained essentially constant (T1/2 = 270.8 days). This provided numerous lesion target:background ratios ranging from 1.6:1 up to 37:1 in the different phantom compartments, as well scans at four different levels of statistical noise.
Fig. 3.
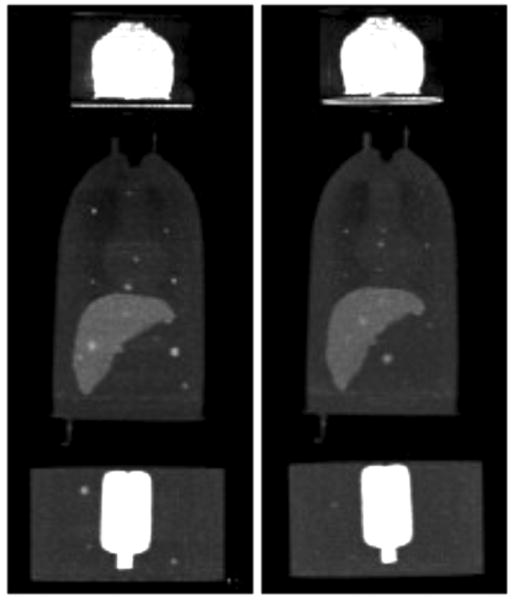
Example maximum intensity projection (MIP) images of the scans with lesion present on day 1 (left) and day 2 (right). These images were formed by averaging the images for all four scans from each day to obtain low noise images so that the lesions could be easily visualized, and the upper limit of the greyscale was lowered to enhance visualization of the body compartments.
All scan data were acquired and stored in 32-bit listmode format, with span (“axial-compression”) of 11 and a maximum ring difference of 38. The listmode files were later binned into projection-image histograms, with each sinogram having 336 radial bins and 336 azimuthal bins. The CT scans were processed to obtain maps of the linear attenuation coefficient at 511 keV for PET attenuation correction. Since the silicone gel used for the lesions acts as a slight contrast agent on CT and could result in a slight over-correction for attenuation, the linear attenuation coefficients in the lesion voxels were manually set to the correct value (0.0981 cm−1).
B. Image Reconstruction
All scans were reconstructed by each of the four algorithms discussed earlier using the scanner manufacturer's software. The first two algorithms, FORE-OSEM2D and AW-OSEM3D, used a ray-driven projector based on Joseph's method [21] along with a pixel-driven backprojector [22], [23]; as such, the projector and backprojector for these algorithms were not true transposes of each other (i.e., they were “unmatched”). The LOR-OSEM3D reconstruction used a matched ray-driven projector—backprojector pair that explicitly mapped from the image voxels to the unevenly-spaced raw coincidence LORs (and vice versa), but had no resolution modeling. The final algorithm incorporated an accurate model for the spatially-variant PSF into LOR-OSEM3D, using the methods described in [15].
Corrections for normalization factors, attenuation, scatter, and randoms were matched between the algorithms, with each being applied either to unevenly-spaced LORs or arc-corrected projection elements according to the needs of each algorithm. As such, the same correction estimate was used for each case, differing only in the manner of implementation as summarized in Table I. Randoms were estimated in raw LOR-space from a delayed coincidence window with randoms-smoothing applied [24], and scatter was estimated in evenly-spaced projection space using the technique of Watson [25]. Each correction was then either applied as is, arc-corrected, or “un-arc-corrected” for each algorithm as needed.
TABLE I. Implementation of Corrections for Each Algorithm.
| Algorithm | Raw LORs | Arc-corr. Bins | Prior to Recon | During Recon |
|---|---|---|---|---|
| FORE-OSEM2D | NR | AS | NARS | |
| AW-OSEM3D | NR | AS | NRS | A |
| LOR-OSEM3D and LOR-OSEM3D+PSF | NARS | NARS |
N = normalization; A = attenuation; R = randoms; S = scatter
The reconstructed image matrices for each algorithm had a voxel size of 4.07 mm in-plane and slice thickness of 2.03 mm. Each reconstruction was run to ten iterations using seven subsets with 24 angles per subset, and the results of each iteration were saved. The images were then convolved with 3D Gaussian filters with kernel widths ranging from 0.0 (no filter) to 2.0 voxels s.d. in 0.2 voxel increments (corresponding to full-width at half-maximums ranging from 0.0 to 4.7 voxels). These 3D filters were applied isotropically in voxel-space, and thus anisotropically smoothed in the transverse direction more heavily than the axial direction according to the ratio of pixel width (4.07 mm) to slice thickness (2.03 mm). This helped reduce the degree of axial lesion overlap, which was further handled as described below.
C. Lesion Tracking and Processing
The images from the first two days of scanning had lesions present. The PET and CT images were used to identify the true lesion locations for each day, and the transaxial slice containing the center of each lesion was extracted from each 3D PET image. In cases where there was some overlap of a second lesion into the target slice, the voxels surrounding the offending nontarget lesion were blended with the corresponding lesion-absent image (Day 3) in order to effectively “erase” the nontarget lesion from the slice. A semi-automated routine was used here, with the operator manually ensuring that no remnants of the offending lesion remained in the slice, and also that the borders of the blended region were smoothly integrated into the background and could not be visually identified on the final image.
For each lesion-present image, a lesion-absent image was also obtained by extracting the same slice from the corresponding Day 3 scan. When more than one lesion from either Day 1 or Day 2 fell into nearly the same slice, a nearby lesion-absent slice was used so that no duplicate or immediately-adjacent slices were included in the extracted data. This process provided a total of 52 lesion-present and 52 lesion-absent slices, each with four different background activity levels, for a total of 208 lesion-present and 208 lesion-absent cases. Each of these cases were reconstructed by the four reconstruction algorithms, each with 10 iterations × 11 filters = 110 combinations of reconstruction parameters. This provided a total of 183 040 2D images for LROC analysis.
D. Channelized Nonprewhitened Observer
Numerical observers have been found to correlate with human observer performance in many cases, though further development and evaluation is necessary to understand the full capabilities and limitations of these model observers. In this work, the channelized nonprewhitened (CNPW) observer [16]–[18] was used within the LROC framework to study the effect of changing the number of iterations and post-reconstruction filter upon lesion detection performance for each algorithm. As such, the CNPW observer was used to select the reconstruction parameters (number of iterations, strength of post-filter) that maximized lesion-detection performance for each algorithm. However, the CNPW observer was not used to provide our final ranking of relative lesion-detection performance between algorithms—we rely upon human observers for this task. In this way, the model observer read large numbers of images for each algorithm in order to optimize reconstruction parameters (which would have been impractical with human observers), but human observers provided the final comparison and ranking among algorithms.
Application of the CNPW in this paper draws heavily upon the work of Gifford et al. [17], and the implementation used here is based closely upon that paper. Other model observers, such as the channelized Hotelling observer, require detailed information about image statistics that was not readily available from the phantom studies used in this work. Briefly, the CNPW observer as applied here computes a perception measurement, zn, at each image voxel according to
| (1) |
where is the CNPW template image at voxel n, f̂ is the image to be tested, and b̄ is the mean lesion absent image. The CNPW template is the mean 2D lesion profile over a set of training images, mathematically projected onto a set of channel responses, and centered upon voxel n. We used the same ten dense difference-of-Gaussian channels as described in [17], and the interested reader is referred to that paper for additional details.
The CNPW is receptive to use with experimental phantom data because it only requires knowledge of the mean lesion profile and mean lesion-absent images, not higher-order image statistics. For each reconstruction scheme and set of reconstruction parameters, we had 208 lesion-present images available from the phantom experiments. These included four sets each of the same 52 lesions with differing background activities (but identical relative background distributions between compartments). Similarly, each of the corresponding 52 lesion-absent slices had four scans with different activity levels but identical relative distributions. These data imposed certain limitations on the training and applications of the CNPW observer as described below. Three methods of training the CNPW observer with the experimental data were tested and compared in this work.
Training of the CNPW observer consists of computing the 2D template image slice and mean lesion-absent background image slice b̄. Here, the background image b̄ for each of the 52 lesion locations was obtained by averaging and scaling the corresponding lesion-absent slices from the Day 3 scans as follows. In order to separate the training images from the test images for a given activity level (i.e., scans 1–4 from each day), the three lesion-absent images from the other three activity levels were averaged. The resultant image was then scaled so that the total voxel sum of the background and test images matched (where both sums excluded voxels in the location of any lesion, when present in the test image). In this manner, the lesion-absent test images (f̂) and corresponding mean background images (b̄) came from mutually-exclusive scans, hence any noise blobs present in (f̂) were not automatically removed through subtraction of (b̄).
The three observer training methods studied each used the background estimate just described, but differed in how the template was computed. In the first method (I), the mean lesion profile was obtained by averaging the difference between all 208 lesion-present images (f̂) and the corresponding mean-background images (b̄). This method had the advantage of using all available images and thus reducing the noise in the estimate of , but it also meant that the observer had some prior knowledge of the test cases since the same lesion-present images were used for both training and testing. The second method (II) created a different template for each lesion-present test image by averaging the other 207 lesion profiles. This resulted in 208 templates, causing greater complexity but retaining low noise in the estimate of This approach, however, was inexact since LROC analysis requires that the ratings from all test cases be analyzed as a group, but different templates provide a different scaling for the ratings (though such differences were very small—with magnitudes on or order of the difference between averaging 207 versus 208 lesion profiles). The third training method (III) mimicked the training of the human observers, where the mean lesion profile was computed from the same 32 lesion-present cases as used to train the human observers (as described in Section II-E). This training method had the advantage of completely separating the observer training from the test images, but it also had the greatest statistical uncertainty in the estimate of since it was based on only 32 lesion profiles.
The CNPW observer was used in this paper 1) to study the effect of changing the number of iterations and post-reconstruction filter for each reconstruction scheme, guiding selection of these parameters for the human observer study and 2) to help select which lesion-present test cases to include in the human observer study. A brief comparison of the model and human observer results was also performed as a secondary objective. Training method I was used for the first two objectives, and all three training methods were applied and compared along with the comparison to human observers. In each application of the CNPW observer, a mask defining the search region was created to cover all potential lesion locations but exclude voxels near the body contour or near edges between phantom structures (such edges can confound performance of the CNPW observer). The observer was applied (1) to each voxel within the mask, and the location providing the highest rating zn was used as the observer's location most likely to contain a lesion. The threshold radius for correct localization was then determined, and the probability of correct localization PLOC was computed as the fraction of lesions found. The area under the LROC curve, ALROC, was computed by Wilcoxon integration of the empirical LROC curve [26]. The uncertainty in each of these figures-of-merit was then estimated as the standard deviation over 10 000 bootstrap resampling trials for each case (as in [17], resampling the CNPW data with replacement for each trial).
E. Human Observer Study
The results of the CNPW analysis were used to select the number of iterations and strength of the post-reconstruction filter that provided the best lesion detection performance. Note that this involved reading 183 040 test images with the CNPW observer, and could not be practically accomplished with human observers. Images for each of the four reconstruction schemes, with optimized parameters, were then read by six human observers, including five experienced Ph.D. researchers in medical imaging and one graduate student. In previous lesion-detectability work with a very similar phantom [19], we used both trained nuclear medicine physicians and Ph.D. researchers in medical imaging. In that study, both groups of observers yielded identical ranking results, suggesting that Ph.D. medical imaging researchers are valid observers for reading these types of phantom images where medical knowledge does not apply. Recall that there were 52 lesion locations, and that each location had four images with different background activity levels (resulting in different target:background ratios and noise levels). One concern was that observers might begin to memorize lesion locations if they viewed multiple images with the same lesion location. Similarly, since the lesion contrast increased as the background decayed over the four repeat scans, visualization of each lesion differed significantly over the four scans. Using the CNPW results and visual assessment, lesions that were deemed either obviously detectable or completely undetectable for all reconstruction schemes were noted and excluded from the test image sets. The remaining 87 lesion-present cases and corresponding 87 lesion-absent cases were assigned to two groups: a training group of 64 images and a test group of 110 images, for each reconstruction scheme.
These images were then presented to the observers using the interface shown in Fig. 4, where the training images for a given reconstruction scheme were read first and immediately followed by the test images for that scheme. The observers were asked to perform two tasks for each image: provide a confidence rating on a six point scale that there was or was not a lesion present in the image, and select the location most likely to contain a lesion by a mouse click. For the training images, the interface immediately provided feedback in the form of the truth regarding lesion present/absent, and the true lesion location (when present). The observers were informed that approximately half of the images would contain no lesions and half would contain exactly one lesion, and they were encouraged to use the full range of the six point scale. In order to minimize the effects of reading order, the images for each reconstruction scheme were presented in randomized order, and the order of the reconstruction schemes was likewise randomized between observers. The reading took place in a darkened room, and the display monitor settings were calibrated so that the greyscale provided a log-linear relationship [27]. No restraint was placed upon reading time, and the typical reading session lasted between 60–90 min.
Fig. 4.
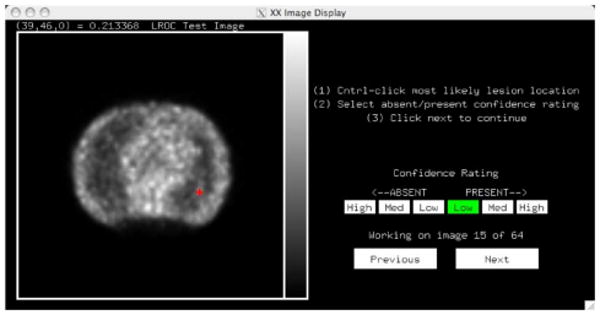
The image display interface used for the human observer studies presented a single 2D image. The observer was asked to select a confidence rating by clicking on the six-point scale as shown, and mark the location in the image most likely to contain a lesion (red crosshairs). When training, the interface then would provide feedback as to the truth (lesion present versus absent) and actual lesion location (when present).
Once complete, the observer data were analyzed to compute the probability of correct localization (or more simply, the fraction found) for each reconstruction scheme, and Wilcoxon numerical integration [26] was used to compute the area under the empirical LROC curve. A two-way ANOVA with the Tukey HSD test was used to test statistical significance of the results. The inter-observer sample standard deviations for PLOC and ALROC are quoted in the result tables as estimates of the uncertainties in these figures-of-merit.
III. Results
A. Images and Count Levels
Table II lists the total number of prompt coincidences over all six bed positions, plus the total scatter and randoms levels, for each of the four background activity levels (corresponding to the four scans acquired on each day of experiment). The noise equivalent count rates (NECR) for these scans were in the range of 20–85 kcps for bed positions in the thorax and abdomen, and were typical of patient NECRs for this scanner [28], [29]. Note that there is considerable variability in injected dose and scan times (ranging from approximately 90 s to 4–5 min per bed position) at different clinical sites. Overall, the count density of these phantom scans (corresponding to a small-to-medium sized patient) fell in the middle-to-lower range of typical count levels encountered for clinical FDG cancer imaging. Example images for each of the four reconstruction schemes are shown in Fig. 5. Here, striking differences in noise quality and texture can be seen, even though each algorithm reconstructed identical scan data.
TABLE II. Count Levels and Data Characteristics1.
| Total Prompts | Scatter Fraction S/(T+S) | Randoms / Trues Ratio (R/T) | |
|---|---|---|---|
| Scan 1 | 389M ± 61M | (37.4 ± 2.2)% | 1.00 ± 0.11 |
| Scan 2 | 255M ± 38M | (35.4 ± 0.8) % | 0.75 ± 0.07 |
| Scan 3 | 170M ± 25M | (34.7 ± 0.7) % | 0.58 ± 0.05 |
| Scan 4 | 115M ± 16M | (34.2 ± 0.8) % | 0.47 ± 0.03 |
Mean ± s.d. over the three days of experiment
Fig. 5.
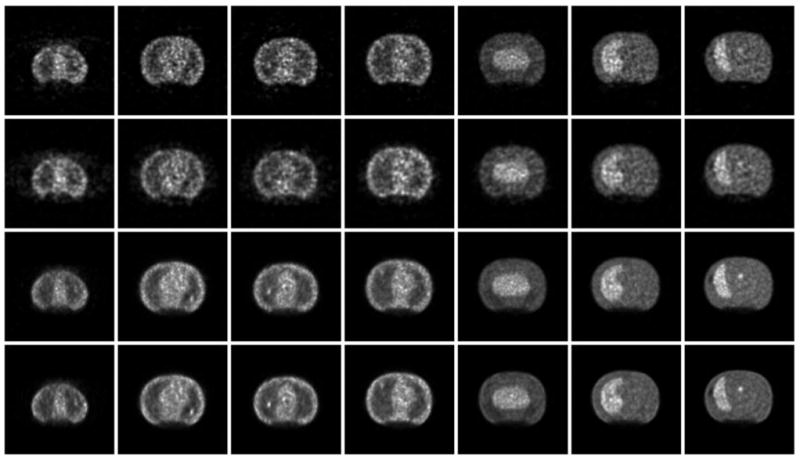
Example transaxial slices, each containing a lesion, for the four reconstruction schemes with six iterations and filters shown in Table III: (from top to bottom) FORE-OSEM2D, AW-OSEM3D, LOR-OSEM3D, and LOR-OSEM3D+PSF. The images show a sampling of phantom slices ordered from more superior (left) to more inferior (right) axial locations. Note that identical scan data were reconstructed for each case, and all differences are due to the different reconstruction processing. Striking differences in noise texture and depiction of the lesions can be seen for the different reconstruction algorithms.
B. Model Observer Results
The CNPW observer was applied to all 208 lesion-present and 208 lesion-absent 2D images for each reconstruction scheme as described in the Methods. Fig. 6. shows the fraction of lesions found plotted as a function of the radius threshold for correct localization for each of the algorithms (at six iterations and the filters shown in Table III). A radius threshold of 2.5 voxels was selected based on these data, and used for all CNPW observer results.
Fig. 6.
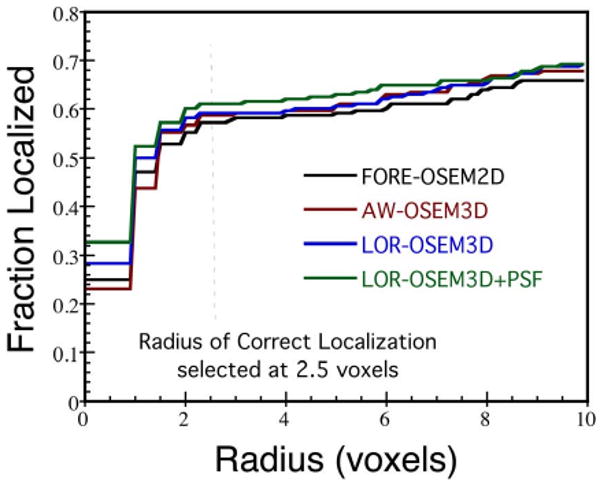
The fraction of lesions correctly localized, plotted as a function of radius threshold for correct localization, for each reconstruction algorithm and the CNPW observer.
TABLE III. CNPW Observer Results—All Images.
| No. Iter. | Filter s.d. (voxels) | PLOC | ALROC | |
|---|---|---|---|---|
| FORE-OSEM2D | 6 | 0.8 | 0.57 ± .034 | 0.48 ± .029 |
|
| ||||
| AW-OSEM3D | 6 | 0.6 | 0.59 ±.033 | 0.49 ± .029 |
|
| ||||
| LOR-OSEM3D | 10 | 0.8 | 0.62 ± .034 | 0.52 ± .029 |
| 6 | 0.6 | 0.59 ±.034 | 0.51 ±.029 | |
|
| ||||
| LOR+PSF | 10 | 0.4 | 0.61 ±.034 | 0.55 ± .030 |
| 6 | 0.4 | 0.61 ±.033 | 0.54 ±.030 | |
Fig. 7 shows ALROC plotted as a function of the Gaussian filter size for iterations 1–10 of each algorithm; similar results were obtained for PLOC (not shown). These data reveal interesting trends with respect to lesion-detection performance for the different reconstruction parameters. Each algorithm without PSF modeling had a peak in ALROC for filter s.d. of about 0.6–0.8 voxels, whereas the algorithm with PSF modeling displayed different behavior. When modeling the PSF, near-maximal ALROC was obtained with no post-reconstruction filter. Performance improved marginally up to a filter s.d. of 0.4 voxels, beyond which ALROC dropped with increasing filter strength. This is consistent with previous results showing improved spatial resolution for the same noise levels with PSF modeling [14], [15], [30], and may also in part reflect how PSF modeling introduces noise correlations similar to those imposed by Gaussian filtering. One potential advantage of PSF modeling from a practical standpoint is that the lesion detection performance for LOR-OSEM3D+PSF was less sensitive to the filter strength than the other algorithms, which may translate to less sensitivity to user-variability in selecting filter parameters in practice.
Fig. 7.
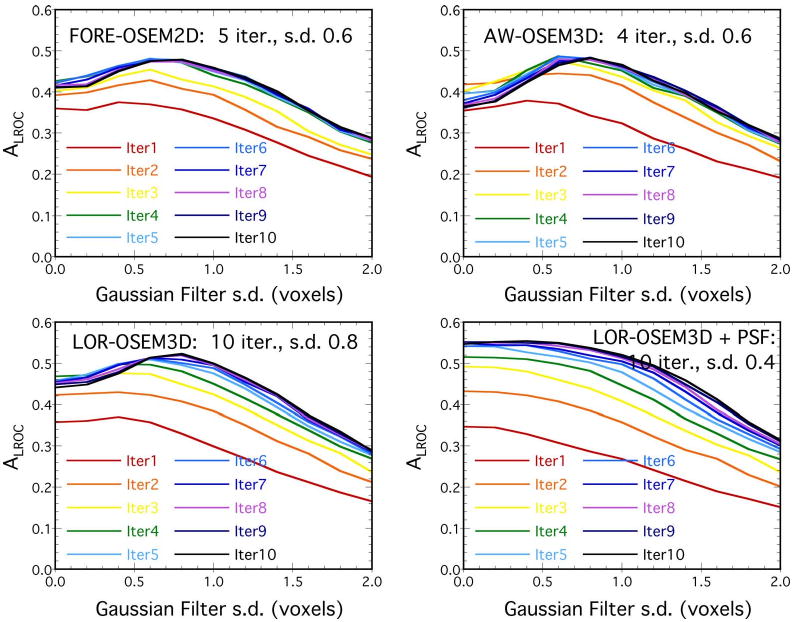
CNPW results, showing how ALROC changed as a function of filter width (s.d.) from 0.0–2.0 voxels, with a different line for iterations 1–10. The parameters providing the highest ALROC for each algorithm are shown on the plots. In each case, the difference in performance between successive iterations got smaller as the number of iterations increased, and the difference in ALROC between 6 and 10 iterations was relatively small for all algorithms.
As highlighted in Fig. 8, all algorithms showed rapid improvement in ALROC over the first 4–5 iterations. At later iterations, however, FORE-OSEM2D and AW-OSEM3D experienced slight losses in performance, whereas the LOR- OSEM3D algorithms showed gradual improvement out to the maximum number of iterations studied (10). This may reflect a difference in the rate of recovery of image features for the different algorithms, but it also may suggest that the more sophisticated algorithms are still recovering more detailed information about the source distribution at later iterations.
Fig. 8.
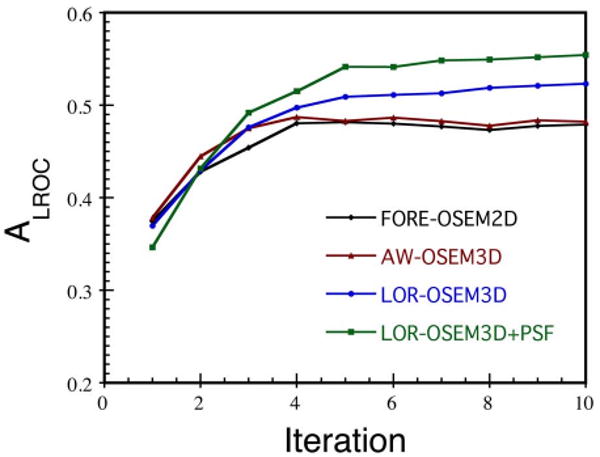
CNPW results for all algorithms showing the dependence of ALROC upon the number of iterations. For each datapoint, the filter which maximized ALROC was used. The LOR-OSEM3D algorithms showed continued improvement out to the later iterations studied, whereas the other algorithms experienced slight losses in performance at the later iterations.
Table III shows the CNPW results for each algorithm with the reconstruction parameters that maximized lesion-detection performance. Recall that the intent of the CNPW observer in this work was to select the number of iterations and postfilter strength for each algorithm that maximized lesion-detection performance (at least in the CNPW sense), and not to directly compare the algorithms (for which we rely upon human observers). As such, inter-algorithm comparisons were not drawn from Table III. For the LOR-based algorithms, near-maximal performance was obtained at six iterations. Since it was deemed that six iterations was more practical than ten iterations for clinical use, we selected six iterations for each algorithm for the human observer study and used the filters shown in the table. Since the LOR-based algorithms outperformed the others, this should have the net effect (if any) of narrowing the gap between the algorithms for the human observer study, and thus was considered a conservative selection of parameters. Using the manufacturer's currently-available reconstruction code, six iterations LOR-OSEM3D+PSF with seven subsets required 325 s on a Dual CPU 2.3-GHz Intel Xeon processor for a single bed position. Similar image quality could be obtained in fewer iterations using more subsets (e.g., the same code takes 172 s to reconstruct three iterations LOR-OSEM3D+PSF with 21 subsets). These reconstruction times for LOR-OSEM3D+PSF are reasonable for routine clinical use. Furthermore, accelerated projectors have been shown to be capable of performing reconstructions with these algorithms in one minute or less per bed position [13], [31].
C. Human Observer Results
Fig. 9 plots the fraction of lesions correctly localized versus the radius of correct localization for the human observer study. As with the CNPW observer, a radius threshold of 2.5 voxels was found to lie on the plateau and was used for all results. Recall that the CNPW observer results just presented read all 208 lesion-present and 208 lesion-absent images for each reconstruction scheme, whereas a subset of these images were presented to the human observers for training (64 images) and testing (110 images). Table IV shows the results of the human observer study. Recall that PLOC results provide information regarding lesion localization independent from the rating, whereas ALROC takes into account both the observer's rating and localization information. We focus our discussion of the results upon the more complete measure, ALROC, unless otherwise noted.
Fig. 9.
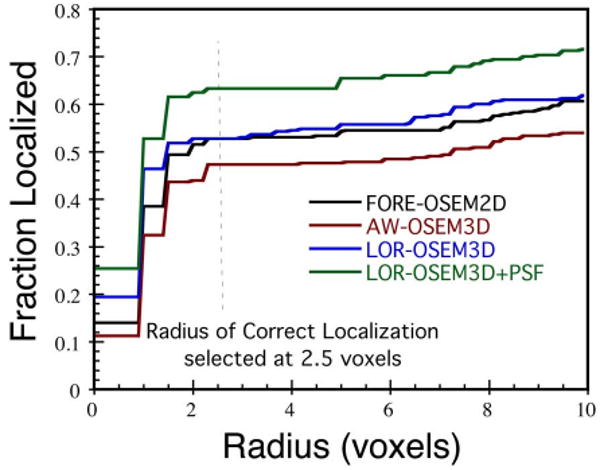
The fraction of lesions correctly localized by the human observers, plotted for each reconstruction algorithm as a function of radius of correct localization. The data show the classic pattern of a fast initial rise, a plateau (where the radius threshold was selected), followed by a gradual rise due to random selection of neighboring sites.
TABLE IV. Human Observer Results—110 Test Images.
| PLOC | ALROC | |
| FORE-OSEM2D | 0.53 ± .023 | 0.41 ±.048 |
| AW-OSEM3D | 0.47 ± .075 | 0.36 ± .083 |
| LOR-OSEM3D | 0.53 ±.041 | 0.45 ± .039 |
| LOR+PSF | 0.63 ±.051 | 0.55 ± .048 |
FORE-OSEM2D and AW-OSEM3D performed very similarly, and the difference between these algorithms was not statistically significant (p > 0.40). Recall that neither of these two algorithms are Ordinary Poisson methods, and hence neither fully utilizes the statistical model with which MLEM (and OSEM) is based. Though one might expect that the additional computation required for the 3D iterative algorithm would bring benefits over the rebinning->2D iterative reconstruction, such an improvement was not observed in this study. LOR-OSEM3D provided significantly higher lesion-detection performance than AW-OSEM3D (p = 0.076), and the addition of the PSF model improved performance over LOR-OSEM3D without PSF model (p = 0.024). These results demonstrate improved lesion-detection performance for the more sophisticated algorithms. LOR-OSEM3D differed from AW-OSEM3D in that 1) all corrections, not just attenuation correction, were incorporated into the reconstruction to achieve an Ordinary Poisson method, 2) the projection data were not pre-processed for the geometric correction, which introduced some interpolation error for the AW-OSEM3D projection data, and 3) a matched projector-backprojector pair was used for LOR-OSEM3D, whereas AW-OSEM3D had an unmatched projector-backprojector. It is not clear which of these differences had the most impact on lesion detection performance, but in the aggregate they provided the improvement that was measured.
The addition of the PSF model with the LOR-OSEM3D algorithm also provided a statistically-significant improvement in lesion detection performance. Modeling the spatially-variant PSF in PET is analogous to modeling the depth-dependent collimator-detector response function in single-photon emission computed tomography (SPECT), which has also been found to improve lesion detection performance [32]–[34]. In our study, the LOR-OSEM3D reconstruction without PSF model used a ray-driven projector/backprojector, whereas the reconstruction with PSF model used a more sophisticated projector based on measuring the actual system responses to point sources [15]. As such, the projector with PSF model can, in some sense, be considered a volumetric projector which takes into account both the sensitive volume of each coincidence “LOR” as well as the spatially-variant and asymmetric nature of the PSF. It is not clear how much of the measured improvement was due to volumetric projection integrals (as opposed to the line-integrals of the ray-driven projector) and how much was due to the incorporation of the spatial-variance and asymmetry of the PSF. The most accurate modeling is achieved by accounting for both components, and provided the statistically-significant improvement in lesion detectability measured here.
D. Comparison of CNPW and Human Observers
The primary objective of this work was to compare and rank the lesion detection performance of the four reconstruction algorithms as just presented. However, a comparison of the CNPW and human observer results may also provide some insight into the complex relationship between the model and human observers, and the potential for model observers to replace humans for some applications. Here, the CNPW observer was retrospectively applied to the same 110 test images read by the human observers. Note that this comparison was made without strict task equivalence, as the human observers were allowed to adjust the image display greyscale but no such ability was built into the CNPW observer. Fig. 10 shows the results of this comparison. The CNPW and human observers provided identical rankings of the different algorithms: no statistically-significant difference between FORE-OSEM2D and AW-OSEM3D, improvement in moving to LOR-OSEM3D, and further improvement through the addition of the PSF model. Note, however, that the model and human observers had differences in the magnitude of each figure-of-merit, with the model observer generally outperforming the human observers. These data suggest that the CNPW observer as implemented is useful for ranking different test cases, but does not completely replace the human observer. The result that both types of observers provided the same rankings is comforting, however, as the CNPW provides a powerful means for testing a large number of image sets (such as optimizing the number of iterations and filter parameters as used in this paper).
Fig. 10.
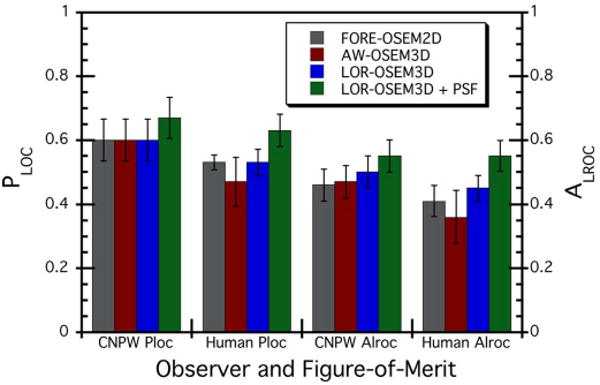
Comparison of PLOC and ALROC results for the CNPW observer versus human observers. The CNPW results shown here are for the same 110 test images as read by the human observers; however, strict task-equivalence did not apply since the human observers were permitted to adjust the image display greyscale whereas no such ability was built into the CNPW observer.
An additional check was performed to test the validity of using the CNPW observer to select the number of iterations and postfilter for the human observer study. One human observer was asked to read three sets of images for the LOR-OSEM3D algorithm: three iterations with filter s.d. of 0.6 voxels, six iterations with s.d. = 0.6, and six iterations with s.d. = 1.0. This reading session was performed six weeks after the observer's main reading session in order to reduce any memorization of lesion locations. The results and comparison with the CNPW observer for the same three sets of parameters are shown in Table V. Both the CNPW and human observer ranked the case with three iterations behind the others. At six iterations, the CNPW observer found slightly better performance at the weaker filter, whereas the human observer found mixed figures-of-merit for the two filters. These results show agreement between the CNPW and human observer rankings to well within the uncertainties of the data, and would suggest but not conclusively demonstrate that the CNPW observer provided a valid optimization of reconstruction parameters for the study data used herein.
TABLE V. CNPW and Human Observer Results—LOR-OSEM3D.
| CNPW PLOC | CNPW ALROC | Human PLOC | Human ALROC | |
| 3 iter., s.d. 0.6 | 0.57 ± .034 | 0.47 ± .029 | 0.60 ± .066 | 0.52 ± .056 |
| 6 iter., s.d. 0.6 | 0.59 ± .033 | 0.51 ±.029 | 0.64 ± .065 | 0.55 ± .056 |
| 6 iter., s.d. 1.0 | 0.58 ± .034 | 0.49 ± .028 | 0.62 ± .066 | 0.57 ± .060 |
Recall also that three methods for training the CNPW observer were outlined in Section II-D (I—training with all 208 lesion-present images, II—repeated training with 207 lesion-present images excluding the current test case, and III—training with the same 32 lesion-present images as were used to train the human observers). Versions of the CNPW with each training method were applied to the 110 test images read by the human observer. While each training method produced ratings zn of different magnitudes, the ratings were very strongly correlated between training methods (Pearson's correlation coefficient R > 0.999). The LROC analyses produced identical PLOC and ALROC up to two significant digits, regardless of which training method was used. While training methods I and II differed only slightly (difference between averaging over 208 versus 207 lesion profiles), method III used only a small subset of the data that matched the training data used for the human observers. The fact that identical results were obtained for each training method indicates a good level of robustness in the design and application of this model observer for this particular experiment.
IV. Discussion
Lesion detectability studies, such as the LROC study performed here, provide a powerful means of evaluating and ranking image quality improvements resulting from advances in PET imaging technology and algorithms. However, such studies have a number of inherent limitations and cannot comprehensively mimic the broad clinical tasks for which PET is used in cancer imaging. While this study showed a statistically-significant improvement in the ability of observers to detect focal “hot” lesions on a structured noisy background for the more advanced algorithms, the same improvements will not necessarily translate directly to the clinical environment where patient variability, motion artifacts, and imperfections in tracer distributions (such as FDG uptake in inflammatory lesions) come into play. As such, all available information—including studies of image characteristics (spatial resolution, contrast, noise, quantitation), lesion detectability, and clinical evaluations—should be cautiously considered before implementing new algorithms for clinical use.
One of the greatest challenges and limitations of lesion detectability studies is the selection of the lesion population. Ideally, the lesion population would directly represent the clinically-encountered lesion distribution. However, such a population is not well-defined, varies greatly between tumor types, and furthermore cancer patients may have large numbers of undetected tumor cell masses (e.g., micrometastases) which cannot yet be characterized because we do not yet have the means to detect them. Broadly stated, the clinical range of tumor activity levels would range from “very low” (e.g., just above background) to as high as 30 × -40 × background (or even higher) for very metabolically active lesions; however, the clinical distribution within this range is variable and not well defined. When also considering that it is difficult to obtain good statistical power for distinguishing moderately-significant algorithmic improvements (due, in part, to observer fatigue when reading large numbers of images), basing the lesion distribution solely upon the expected clinical population becomes impractical.
In this study, we did not attempt to quantify the PLOC and ALROC that would be observed clinically (which would require, among other things, such a true clinically-representative lesion population). Rather, our objective was to rank the reconstruction algorithms according to their relative lesion-detection performance. This greatly simplified the demands of designing the lesion population. Many clinically-encountered lesions would be either “obvious” (easily detectable for all reconstruction algorithms studied) or “invisible” (undetectable by current PET technologies, regardless of the algorithm used). Since all four algorithms would always succeed (obvious lesions) or always fail (undetectable lesions), including such lesions in the test population would provide no information regarding the differences in performance between algorithms, but would still lead to observer fatigue. Thus, the test lesion population was selected to include only lesions that were somewhat-to-very challenging, thereby emphasizing the differences (if any) between algorithms. While all of these lesions were of clinically-relevant size (6–16 mm) and contrast (lesion:background ratios of 1.6:1—37:1), the test distribution was designed to maximize statistical power for differentiating the reconstruction algorithms. As a result, a valid ranking of algorithms was obtained which would hold true for a broader population of lesions, but little or no information regarding the clinical significance of these differences was obtained. In other words, one can infer that LOR-OSEM3D+PSF would provide better clinical performance than AW-OSEM3D; but one cannot predict how much better it would be based solely on these results.
There are a number of other limitations to this study that should be considered. Though a PET/CT scanner was used, the observers read only the PET images and did not have access to the CT images (which did not mimic a clinical CT scan well). The lesions were spherical, not spiculated as many tumors would be; only a single body habitus was considered; no motion artifacts were present; and the background tracer distribution did not vary across the range that could be encountered. The observers were presented with a single-slice image for each test case, and thus could not use adjacent slices in their decisions. As such, they were not asked to search a 3D volume or allowed to identify multiple targets (such as by AFROC, [35]–[37]) that would more closely mimic the clinical task. More advanced ROC methods could potentially be used to overcome some of these limitations; however, such methods are less well-studied than the method used here, and they would also present additional demands upon the experimental design and on the observers. Finally, as with all lesion-detection studies, the statistical power of this study was limited by the number of images read, and the statistical significance of the results should be carefully considered before drawing conclusions.
V. Summary and Conclusion
The study has used both numerical and human observers to evaluate and rank lesion-detection performance for four fully-3D PET reconstructions schemes. The reconstruction algorithms were chosen to sample major advances in algorithm development made in moving from rebinning to fully-3D iterative techniques, and in improving the statistical and physical models. Advancements in image regularization through penalized likelihood or other techniques were not studied. Both the model and human observers found identical rankings in lesion detection performance for the various algorithms, though the actual values of the detectability measures (PLOCALROC) differed between the model and human observers. The more sophisticated fully-3D iterative reconstruction algorithms with accurate statistical and physical models were found to outperform the simpler reconstructions with less accurate models. We conclude that advancements in fully-3D iterative statistical reconstruction methods have resulted in improved lesion detection performance for modern fully-3D PET tomographs.
Acknowledgments
The authors would like to thank J. Engle for help in preparing the whole-body phantom. The authors would also like to thank C. Forman, J. Roberts, Ph.D., R. Rowley, Ph.D., and D. Ghosh Roy, Ph.D. for their diligent efforts as observers for our study.
This work was supported by the National Cancer Institute under Grant R01 CA107353.
Contributor Information
Dan J. Kadrmas, Email: kadrmas@ucair.med.utah.edu, Utah Center for Advanced Imaging Research, Department of Radiology, University of Utah, Salt Lake City, UT 84108 USA.
Michael E. Casey, Siemens Medical Solutions USA, Knoxville, TN 37932 USA
Noel F. Black, Utah Center for Advanced Imaging Research, Department of Radiology, University of Utah, Salt Lake City, UT 84108 USA
James J. Hamill, Siemens Medical Solutions USA, Knoxville, TN 37932 USA
Vladimir Y. Panin, Siemens Medical Solutions USA, Knoxville, TN 37932 USA
Maurizio Conti, Siemens Medical Solutions USA, Knoxville, TN 37932 USA.
References
- 1.Defrise M, Kinahan PE, Townsend DW, Michel C, Sibomana M, Newport DF. Exact and approximate rebinning algorithms for 3-D PET data. IEEE Trans Med Imag. 1997 Apr.16(2):145–158. doi: 10.1109/42.563660. [DOI] [PubMed] [Google Scholar]
- 2.Defrise M, Liu X. A fast rebinning algorithm for 3-D positron emission tomography using John's equation. Inverse Problems. 1999;15:1047–1065. [Google Scholar]
- 3.Hudson HM, Larkin RS. Accelerated image reconstruction using ordered subsets of projection data. IEEE Trans Med Imag. 1994 Dec.13(4):601–609. doi: 10.1109/42.363108. [DOI] [PubMed] [Google Scholar]
- 4.Liu X, Comtat C, Michel C, Kinahan P, Defrise M, Townsend D. Comparison of 3-D reconstruction with 3-D-OSEM and with FORE+OSEM for PET. IEEE Trans Med Imag. 2001 Aug.20(8):804–814. doi: 10.1109/42.938248. [DOI] [PubMed] [Google Scholar]
- 5.Lange K, Carson R. EM reconstruction algorithms for emission and transmission tomography. J Comput Assist Tomogr. 1984 Apr.8:306–316. [PubMed] [Google Scholar]
- 6.Shepp LA, Vardi Y. Maximum likelihood estimation for emission tomography. IEEE Trans Med Imag. 1982;1:113–121. doi: 10.1109/TMI.1982.4307558. [DOI] [PubMed] [Google Scholar]
- 7.Comtat C, Kinahan PE, Defrise M, Townsend DW. Fast reconstruction of 3D PET data with accurate statistical modeling. IEEE Trans Nucl Sci. 1998 Jun.45(3):1083–1089. [Google Scholar]
- 8.Hebert T, Leahy RM. Fast methods for including attenuation correction in the EM algorithm. IEEE Trans Nucl Sci. 1990;37:754–758. [Google Scholar]
- 9.Barrett HH, White T, Parra LC. List-mode likelihood. J Opt Soc Am A. 1997;14:2914–2923. doi: 10.1364/josaa.14.002914. [DOI] [PMC free article] [PubMed] [Google Scholar]
- 10.Byrne C. Likelihood maximization for list-mode emission tomographic image reconstruction. IEEE Trans Med Imag. 2001 Oct.20(10):1084–1092. doi: 10.1109/42.959305. [DOI] [PubMed] [Google Scholar]
- 11.Huesman RH, Klein GJ, Moses WW, Qi J, Reutter BW, Virador PR. List-mode maximum-likelihood reconstruction applied to positron emission mammography (PEM) with irregular sampling. IEEE Trans Med Imag. 2000 May;19(5):532–537. doi: 10.1109/42.870263. [DOI] [PubMed] [Google Scholar]
- 12.Kadrmas DJ. LOR-OSEM: statistical PET reconstruction from raw line-of-response histograms. Phys Med Biol. 2004 Oct. 2149:4731–4744. doi: 10.1088/0031-9155/49/20/005. [DOI] [PMC free article] [PubMed] [Google Scholar]
- 13.Kadrmas DJ. Rotate-and-slant projector for fast LOR-based fully-3-D iterative PET reconstruction. IEEE Trans Med Imag. 2008 Aug.27(8):1071–1083. doi: 10.1109/TMI.2008.918328. [DOI] [PMC free article] [PubMed] [Google Scholar]
- 14.Alessio AM, Kinahan PE, Lewellen TK. Modeling and incorporation of system response functions in 3-D whole body PET. IEEE Trans Med Imag. 2006 Jul.25(7):828–837. doi: 10.1109/tmi.2006.873222. [DOI] [PubMed] [Google Scholar]
- 15.Panin VY, Kehren F, Michel C, Casey M. fully-3-D PET reconstruction with system matrix derived from point source measurements. IEEE Trans Med Imag. 2006 Jul.25(7):907–921. doi: 10.1109/tmi.2006.876171. [DOI] [PubMed] [Google Scholar]
- 16.Farncombe TH, Gifford HC, Narayanan MV, Pretorius PH, Frey EC, King MA. Assessment of scatter compensation strategies for (67)Ga SPECT using numerical observers and human LROC studies. J Nucl Med. 2004 May;45:802–812. [PubMed] [Google Scholar]
- 17.Gifford HC, Kinahan PE, Lartizien C, King MA. Evaluation of multiclass model observers in PET LROC studies. IEEE Trans Nucl Sci. 2007 Feb.54(1):116–123. doi: 10.1109/TNS.2006.889163. [DOI] [PMC free article] [PubMed] [Google Scholar]
- 18.Gifford HC, King MA, Pretorius PH, Wells RG. A comparison of human and model observers in multislice LROC studies. IEEE Trans Med Imag. 2005 Feb.24(1):160–169. doi: 10.1109/tmi.2004.839362. [DOI] [PubMed] [Google Scholar]
- 19.Kadrmas DJ, Christian PE. Comparative evaluation of lesion detectability for 6 PET imaging platforms using a highly reproducible whole-body phantom with (22)Na lesions and localization ROC analysis. J Nucl Med. 2002 Nov.43:1545–1554. [PubMed] [Google Scholar]
- 20.Hamill JJ, Arnsdorff E, Casey ME, Liu X, Raulstron WJ. A Ge-68 PET hot sphere phantom with no cold shells. IEEE Nucl Sci Symp Med Imag Conf. 2005:1606–1610. [Google Scholar]
- 21.Joseph JM. An improved algorithm for reprojecting rays through pixel images. IEEE Trans Med Imag. 1982;1:192–196. doi: 10.1109/TMI.1982.4307572. [DOI] [PubMed] [Google Scholar]
- 22.Peters T. Algorithms for fast back- and re-projection in computed tomography. IEEE Trans Nucl Sci. 1981;28:3641–3647. [Google Scholar]
- 23.Zhuang W, Gopal S, Hebert T. Numerical evaluation of methods for computing tomographic projections. IEEE Trans Nucl Sci. 1994 Aug.41(4):1660–1665. [Google Scholar]
- 24.Chen M, Panin VY, Casey ME. Randoms mean value estimation with exact method for ring PET scanner. IEEE Nucl Sci Symp Med Imag Conf. 2006:2203–2205. [Google Scholar]
- 25.Watson CC. New, faster, image-based scatter correction for 3-D PET. IEEE Trans Nucl Sci. 2000 Aug.47(4):1587–1594. [Google Scholar]
- 26.Hanley JA, McNeil BJ. The meaning and use of the area under a receiver operating characteristic (ROC) curve. Radiology. 1982 Apr.143:29–36. doi: 10.1148/radiology.143.1.7063747. [DOI] [PubMed] [Google Scholar]
- 27.Nawfel RD, Chan KH, Wagenaar DJ, Judy PF. Evaluation of video gray-scale display. Med Phys. 1992 May–Jun;19:561–567. doi: 10.1118/1.596846. [DOI] [PubMed] [Google Scholar]
- 28.Jakoby BW, Bercier Y, Watson CC, Rappoport V, Young J, Bendriem B, Townsend DW. Physical performance and clinical workflow of a new LSO Hi-Rez PET/CT scanner. IEEE Nucl Sci Symp Med Imag Conf. 2006:3130–3134. [Google Scholar]
- 29.Watson CC, Casey ME, Bendriem B, Carney JP, Townsend DW, Eberl S, Meikle S, Difilippo FP. Optimizing injected dose in clinical PET by accurately modeling the counting-rate response functions specific to individual patient scans. J Nucl Med. 2005 Nov.46:1825–1834. [PubMed] [Google Scholar]
- 30.Engle JW, Kadrmas DJ. Modeling the spatially-variant point spread function in a fast projector for improved fully-3D PET reconstruction (abstract) J Nucl Med. 2007;48:417P. [Google Scholar]
- 31.Engle JW, Kadrmas DJ. Modeling the spatially-variant point spread function in a fast projector for improved fully-3D PET reconstruction. J Nucl Med. 2007;48:417P. [Google Scholar]
- 32.Frey EC, Gilland KL, Tsui BM. Application of task-based measures of image quality to optimization and evaluation of three-dimensional reconstruction-based compensation methods in myocardial perfusion SPECT. IEEE Trans Med Imag. 2002 Sep.21(9):1040–1050. doi: 10.1109/TMI.2002.804437. [DOI] [PubMed] [Google Scholar]
- 33.Gifford HC, King MA, Wells RG, Hawkins WG, Narayanan MV, Pretorius PH. LROC analysis of detector-response compensation in SPECT. IEEE Trans Med Imag. 2000 May;19(5):463–673. doi: 10.1109/42.870256. [DOI] [PubMed] [Google Scholar]
- 34.Narayanan MV, King MA, Pretorius PH, Dahlberg ST, Spencer F, Simon E, Ewald E, Healy E, MacNaught K, Leppo JA. Human-observer receiver-operating-characteristic evaluation of attenuation, scatter, and resolution compensation strategies for (99 m)Tc myocardial perfusion imaging. J Nucl Med. 2003 Nov.44:1725–1734. [PubMed] [Google Scholar]
- 35.Chakraborty DP, Winter LH. Free-response methodology: Alternate analysis and a new observer-performance experiment. Radiology. 1990 Mar.174:873–881. doi: 10.1148/radiology.174.3.2305073. [DOI] [PubMed] [Google Scholar]
- 36.Swensson RG. Unified measurement of observer performance in detecting and localizing target objects on images. Med Phys. 1996 Oct.23:1709–1725. doi: 10.1118/1.597758. [DOI] [PubMed] [Google Scholar]
- 37.Wells RG, King MA, Gifford HC, Pretorius PH. Single-slice versus multi-slice display for human-observer lesion-detection studies. IEEE Trans Nucl Sci. 2000 Jun.47(3):1037–1044. [Google Scholar]


