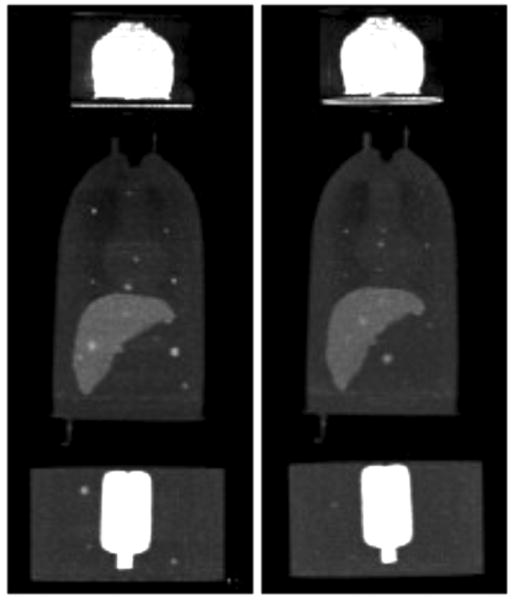
Fig. 3.

Example maximum intensity projection (MIP) images of the scans with lesion present on day 1 (left) and day 2 (right). These images were formed by averaging the images for all four scans from each day to obtain low noise images so that the lesions could be easily visualized, and the upper limit of the greyscale was lowered to enhance visualization of the body compartments.
