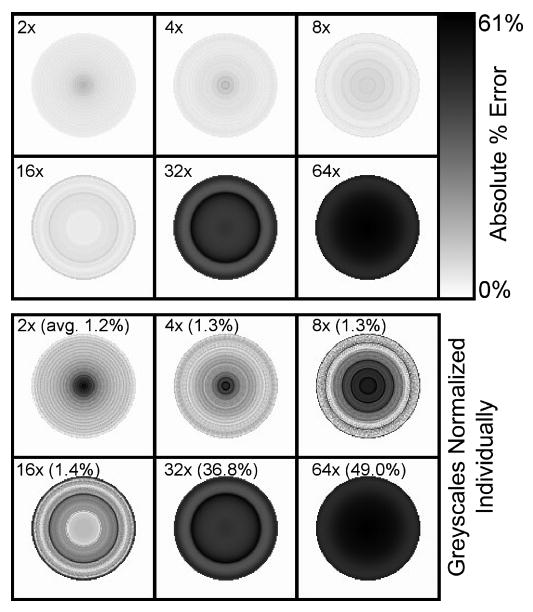
Fig. 4.

Example images showing the depth-dependent behavior of the approximations introduced by the use of depth-compression. These images show the absolute value percent error of a simulated disc phantom one slice thick, centered in the field-of-view, and reconstructed using fully-3-D OSEM with depth-compression factors ranging from 2 to 64 as indicated. The top images share the same greyscale as shown; the greyscales for the bottom images were normalized individually, with average percent error shown in parenthesis. Depth-compression effectively compresses the depth information into coarse slabs, where the center of each slab is unaffected and the upper- and lower-edges of the slab experience the greatest approximation. Since depths map to radii in the reconstructed image, each depth-compressed slab produces a concentric ring on these error images. The extreme case of a depth-compression factor of 128 (equal to the image dimension) would be analogous to SSRB, where there would be one “ring” with little error at the center but very large error at the edge.
