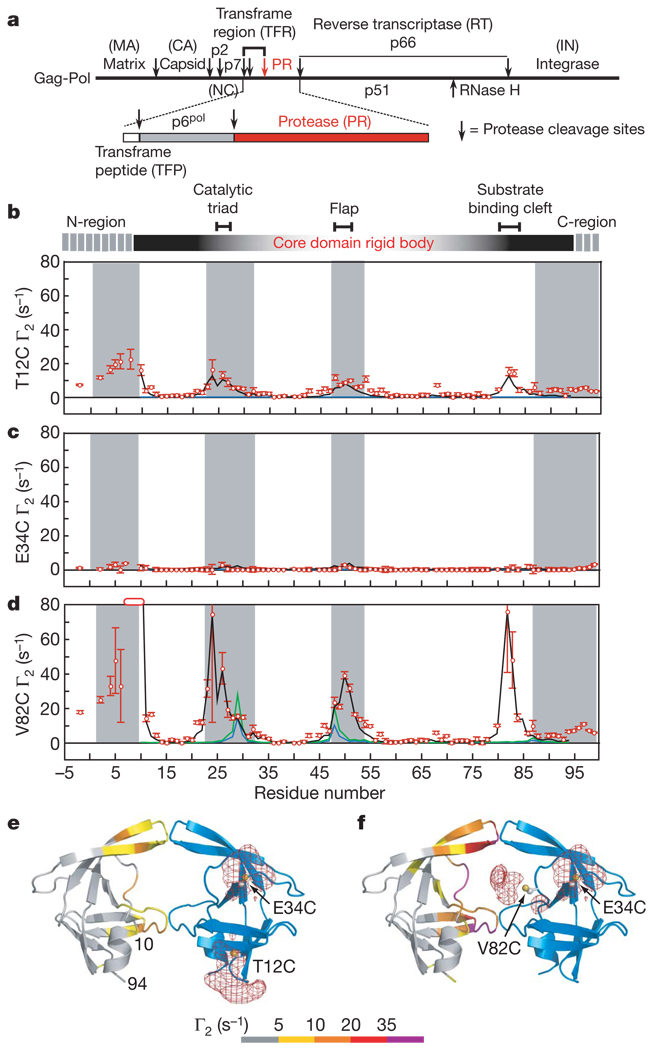
Figure 1. Intermolecular PRE profiles.
a, Organization of the Gag-Pol polyprotein1,2. b–d, Intermolecular PREs observed on U-[2H/13C/ 15N]-labelled SFNFPR(D25N) originating from a spin label conjugated to T12C (b), E34C (c) and V82C (d) of SFNFPR(D25N) at natural isotopic abundance. Residues broadened beyond detection are denoted by open bars. Error bars represent 1 s.d. Γ2 rates back-calculated from the structure of the mature dimer (for the core residues 10–94) at populations of 1% and 2% are shown as blue and green lines, respectively. Average Γ2 rates derived from the top 20 structures of the Ne = 4 simulated annealing calculations at a population of 5% heterodimer are shown as black lines. Grey shaded areas delineate residues that are buried at the dimer interface in the mature protease. e, f, Observed intermolecular PREs originating from the spin label attached to T12C (e) and V82C (f) colour-coded on a ribbon diagram of the mature dimer24 (spin label attached to the blue subunit). Atomic probability density maps25 (plotted at a threshold of 10% of maximum) showing the distribution of the spin-label oxygen radicals are shown as red meshes.

