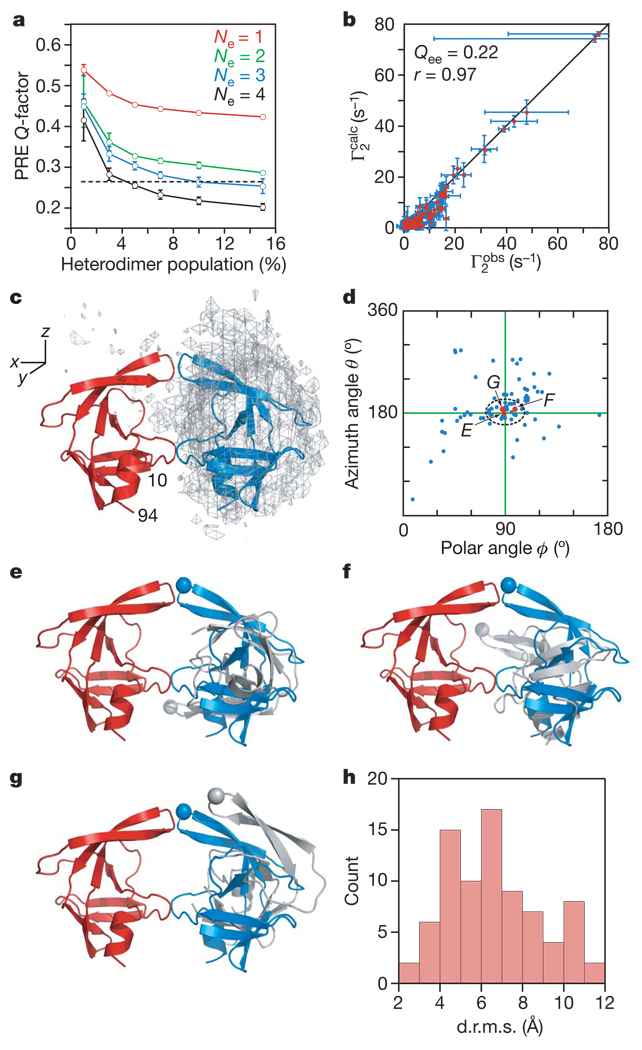
Figure 2. Ensemble simulated annealing and the protease mini-precursor encounter complex ensemble.
a, PRE Q-factor as a function of ensemble size and population of heterodimer. Dashed line denotes the expected Q-factor when agreement between observed and calculated Γ2 rates is comparable to the experimental error in the measurements. b, Correlation between observed and calculated Γ2 rates for Ne = 4 and a heterodimer population of 5%. Qee is the ensemble of ensembles average PRE Q-factor for the 20 calculated Ne = 4 ensembles and r the correlation coefficient. Error bars in a and b represent 1 s.d. c, Atomic probability density map25 (grey mesh, plotted at a threshold of 20% of maximum) showing the distribution of the spin-labelled subunit relative to the isotopically labelled subunit (red ribbon) in the SFNFPR(D25N) encounter complexes. The location of the second subunit in the mature dimer is shown as a blue ribbon. d, Orientations in spherical coordinates of the vector joining the centre of masses of the two interacting molecules in the encounter complexes relative to the coordinate system shown in c with the z axis corresponding to the C2 symmetry axis of the mature dimer. The ϕ,θ angles for the mature dimer are located at the crosshair. e–g, Representative encounter complexes (labelled and denoted by red dots in d) corresponding to the structures with the closest spherical angles (e), the smallest d.r.m.s. (f) and the smallest atomic r.m.s. displacement (g) relative to the mature dimer. The Cα atom of Gly 51 at the tip of the flap is shown as a sphere to guide the eye. The isotopically labelled and spin-labelled subunits are shown in red and grey, respectively; the blue subunit corresponds to the orientation relative to the red subunit seen in the mature dimer. h, Histogram of the d.r.m.s. metric for the Ne = 4 structures (total of 20 × 4 = 80 conformers) at a population of 5% heterodimer.

