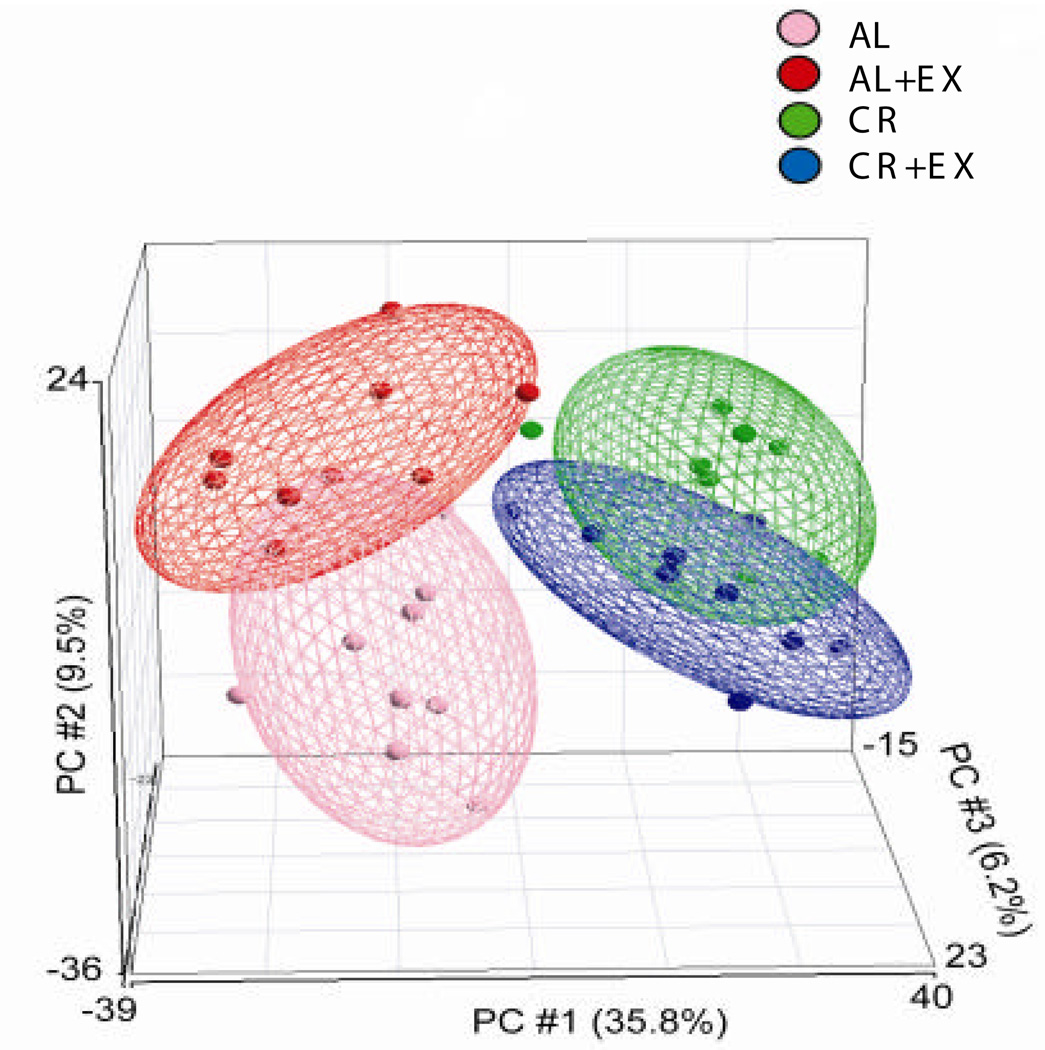
Figure 1. Principal components analysis of mouse mammary gland gene expression after diet and exercise treatment.
An array representing one animal is shown as a single point in the 3-dimensional plot, with the distance between points representing a measure of dissimilarity of expression patterns between the arrays. AL animals are in pink, AL+EX in red, CR in green, and CR+EX in blue. The three largest principal components accounted for 51.5% of the total variance.

