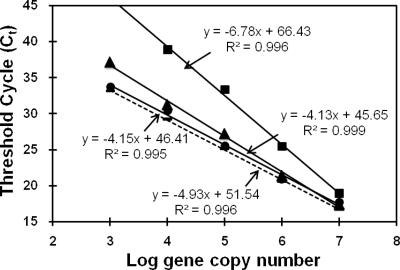
FIG. 1.
Effect of inhibitors present in soil DNA extracts on standard curves generated during qPCR with primer set 4. Solid lines indicate standards spiked with various concentrations of DNA-free soil extract (▪, nondiluted; ▴, 10-fold diluted; •, 50-fold diluted); the dashed line indicates the nonspiked standard curve. Equations of linear regressions and R2 values of every curve are given.

