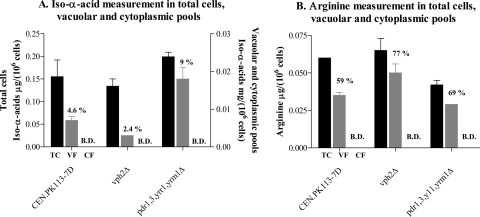
FIG. 5.
Differential fractionation of vacuolar and cytoplasmic pools for iso-α-acid (A) and arginine (B) determination. Values are given in μg/106 cells and are the average of two independent experiments. The percentages are relative to the total biomass determinations. B.D., below detection. Total cells (TC) are represented by black bars, vacuolar fractions (VF) by gray bars, and cytosolic fractions (CF) by white bars.

