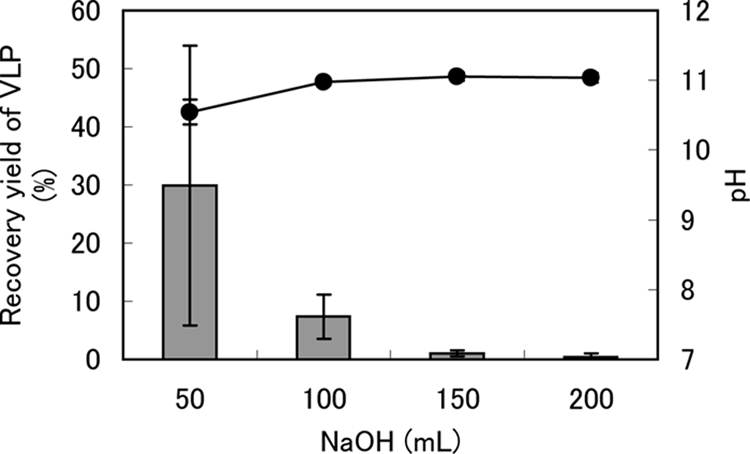
FIG. 1.

Relationship between the VLP recovery yield (%) and NaOH eluate volume using the cation-coated filter method. The gray bars and black circles indicate VLP recovery yields and pHs in NaOH eluant, respectively. VLP abundance in prefiltered water was normalized to 100%. The error bars indicate the standard errors of the means (n = 3).
