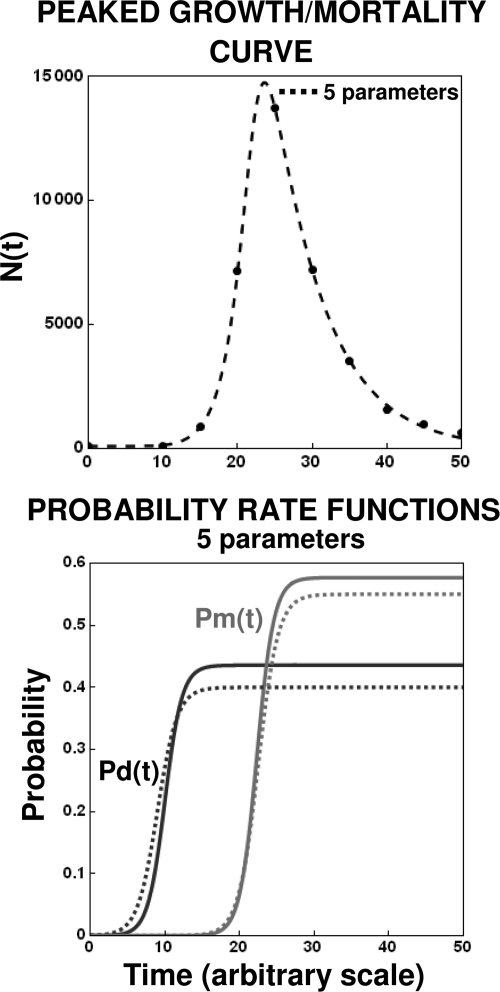
FIG. 11.
Extraction of the division and mortality probability functions from a simulated peaked growth curve. (Top) Fit of the five-parameter version of equation 16; (bottom) corresponding probability functions calculated with the regression parameters (solid lines) and those used to create the data (dashed lines). The parameters for the shown data points’ generation and the retrieved parameters are listed in Table 1.

