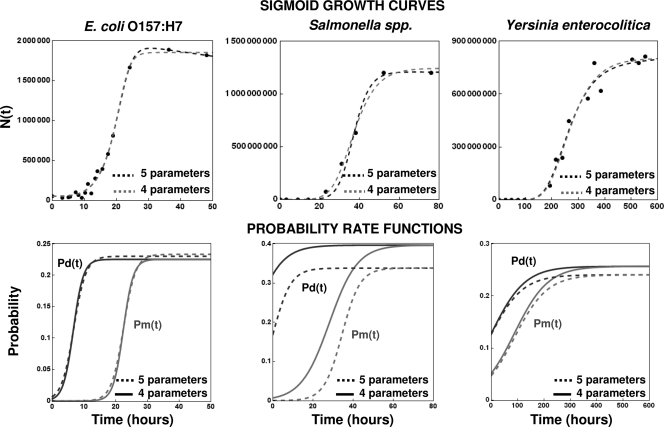
FIG. 12.
Experimental sigmoid growth curves for E. coli O157:H7, Salmonella spp., and Y. enterocolitica fitted with the four- and five-parameter versions of equation 16 as a model (top) and the corresponding estimated underlying division and mortality probability functions (bottom). The experimental data are from Koseki and Isobe (18) and the Food Standard Agency (http://combase.arserrc.gov/; record numbers B124_39 and B002_146), respectively.

