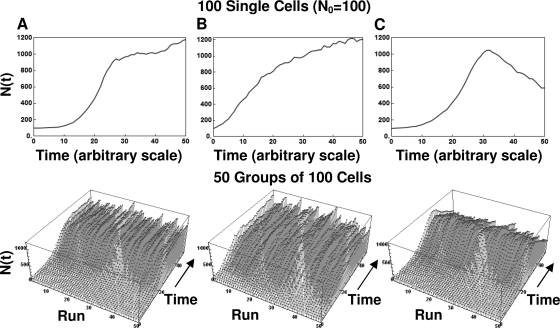
FIG. 9.
Simulated growth curves started from a single group of 100 cells generated with the discrete (stochastic) version of the model (equation 4), with different underlying division and mortality probability functions (top), and life histories of 50 such groups of 100 (bottom). (A) Growth with lag; (B) growth with no lag; (C) peaked growth with lag. Notice that all the growth curves are smooth in comparison with those for the individual cells and smaller groups shown in Fig. 7 and 8, respectively.

