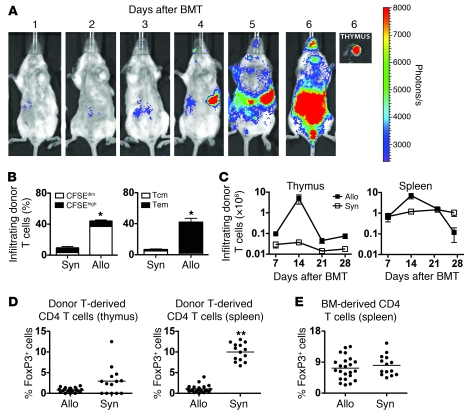
Figure 2. Alloreactive T cells quickly infiltrate the thymus, undergo proliferation, and display an activated phenotype.
(A) In vivo bioluminescence imaging (BLI) of alloreactive T cell (0.25 × 10⁶) migration after transplant. Ex vivo imaging of the thymus confirmed donor T cell infiltration on day 6. Representative images from 1 of 2 identical experiments are shown. (B) Percentages of proliferating alloreactive (CFSEdim) and nonproliferating (CFSEhi) infiltrating donor T cells as well as donor central memory (Tcm, CD44hiCD62Lhi) and effector memory (Tem, CD44hiCD62Llo) T cells as a fraction of all leukocytes (CD45+ cells). n = 14/group, combined from 2 identical experiments (mean ± SEM). *P < 0.05 allogeneic (allo) versus syngeneic (syn). (C) Infiltrating donor T cells in the thymus and spleen (mean ± SEM) at days 7, 14, 21, and 28 in BALB/c (allogeneic) or B6 (syngeneic) recipients. n = 14–15/group, combined data from 1 to 4 identical experiments (mean ± SEM). (D) FoxP3+ T cells derived from infused donor T cells are shown as a percentage of all donor-infused Thy1.1+CD4+ T cells in thymus and spleen at day 28 after allogeneic and syngeneic BMT. **P < 0.01 allogeneic versus syngeneic groups. n = 14, syngeneic; n = 18, allogeneic; combined data from 3 identical experiments. (E) FoxP3+ T cells in the spleen, as derived from donor BM-derived T cells, are shown as a percentage of all donor BM-derived CD45.1+CD4+ T cells on day 28 after allogeneic and syngeneic BMT. P = NS. n = 14, syngeneic; n = 23, allogeneic; combined data from 2 to 4 identical experiments. (D and E) Dots represent individual animals, and horizontal bars indicate the mean.

