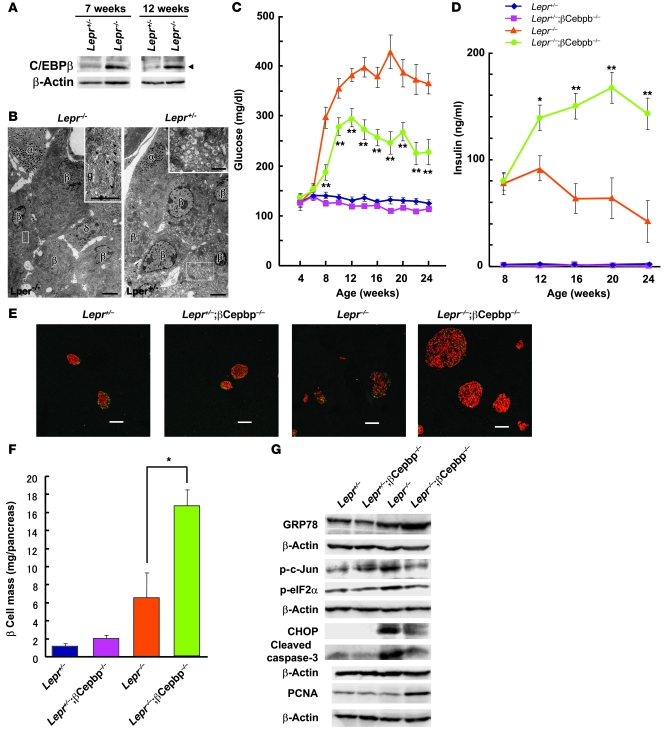
Figure 6. Effects of C/EBPβ ablation in pancreatic β cells of Lepr–/– mice.
(A) Immunoblot analysis of C/EBPβ (arrowhead) in islets isolated from Lepr+/– and Lepr–/– mice at 7 and 12 weeks of age. (B) Electron microscopy of β cells of Lepr–/– and Lepr+/– mice at 8 weeks and 10 months of age, respectively. Higher-magnification views of the boxed regions are shown in the insets. Secretory granules were fewer in number in β cells, but not in α or δ cells, of Lepr–/– mice. Arrowheads indicate enlarged cisternae of the ER near the Golgi complex (g). Scale bars: 3 μm; 1 μm (insets). (C and D) Blood glucose (C) and plasma insulin (D) concentrations of Lepr+/– (n = 6), Lepr+/–;βCebpb–/– (n = 8), Lepr–/– (n = 7), and Lepr–/–;βCebpb–/– (n = 12) mice in the fed state and at the indicated ages. *P < 0.05, **P < 0.01 versus Lepr–/–. (E) Pancreatic sections from 24-week-old Lepr+/–, Lepr+/–;βCebpb–/–, Lepr–/–, and Lepr–/–;βCebpb–/– mice were stained with antibodies to insulin (red) and to glucagon (green). Scale bars: 100 μm. (F) Quantitation of β cell mass in 24-week-old mice of the indicated genotypes. Data are mean ± SEM from 3 mice per genotype. *P < 0.05. (G) Islets isolated from 16-week-old mice of the indicated genotypes were subjected to immunoblot analysis with antibodies to the indicated proteins.

