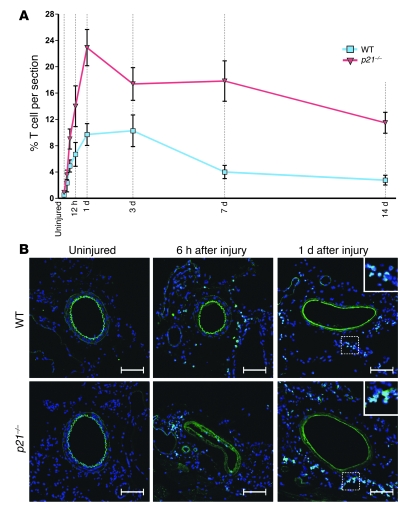
Figure 1. CD3+ T cell infiltration following arterial wire injury.
(A) Relative CD3+ T cell infiltration in WT and p21–/– mice. Data are shown as mean ± SEM. (B) Representative corresponding confocal microscopic images of femoral artery sections showing CD3+ T cells (green) in uninjured vessels and at 6 hours and 1 day following arterial wire injury, with the dashed square indicating an area of higher magnification shown in the upper-right corner for the 1-day images. Width of inset square: 70 μm. Nuclei (blue) were stained with DAPI. Arterial elastic laminae are visible in green due to autofluorescence. Scale bars: 100 μm.

