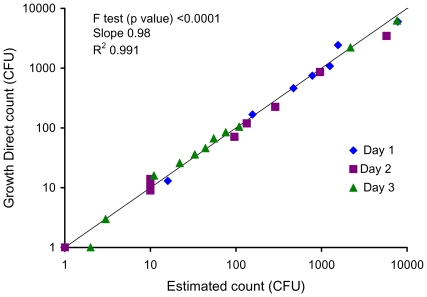
Figure 8. Range, linearity, and correlation to visual plate counting.
The plot correlates the results obtained using the Growth Direct System to the visual plate counting method for samples containing varying numbers of E. coli CFU. For this blinded experiment, samples were prepared and analyzed either using the Growth Direct System or visual plate counting. The Growth Direct System results were determined after incubating for 5 hrs by one analyst. Visual plate counting results were determined after overnight growth (≥18 hr) by a second analyst.

