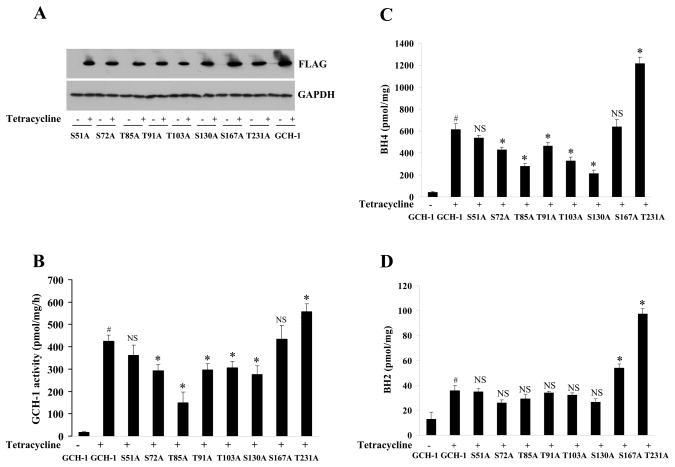
Figure 3.
The effects of phospho-defective mutations on GCH-1 expression, activity, BH4 and BH2. (A) Western blot analysis with anti-FLAG or GAPDH antibody. (B) GCH-1 activity (normalized by protein concentration and expressed as pmol neopterin per mg protein per hour). (C) BH4 levels. (D) BH2 levels. The pterin measured was normalized by protein concentration and expressed as pmol per mg protein. N=3–4, #=p<0.05 vs. GCH-1 cells without tetracycline; *=p<0.05 and NS=not significant vs. GCH-1 cells with tetracycline.

