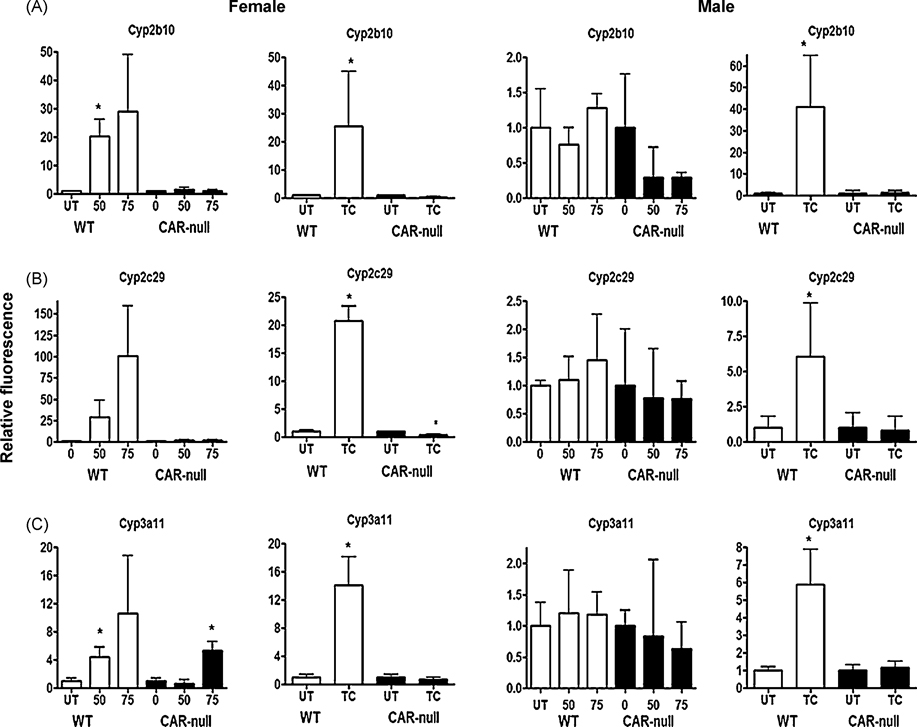
Fig. 3. Cyp2b10, Cyp2c29, and Cyp3a11 show similar patterns of gene expression following treatment with NP or TCPOBOP in wild-type and CAR-null male and female mice.
QPCR was performed as described in the Materials and Methods. On the X-axis, 0, 50, 75 refers to treatment with NP and TC refers to treatment with TCPOBOP. Data are expressed as mean ± SD (n = 5–6) for each of the different P450s in males and females. An asterisk indicates a significant difference from the untreated wild-type or CAR-null mice (p < 0.05). Statistical significance was determined by ANOVA followed with Fisher’s PLSD as the post-hoc test in NP-treated mice compared to their corresponding wild-type or CAR-null controls. Statistical significance was determined by Student’s t-tests in TC-treated mice compared to their corresponding wild-type or CAR-null controls.

