
Figure 2.
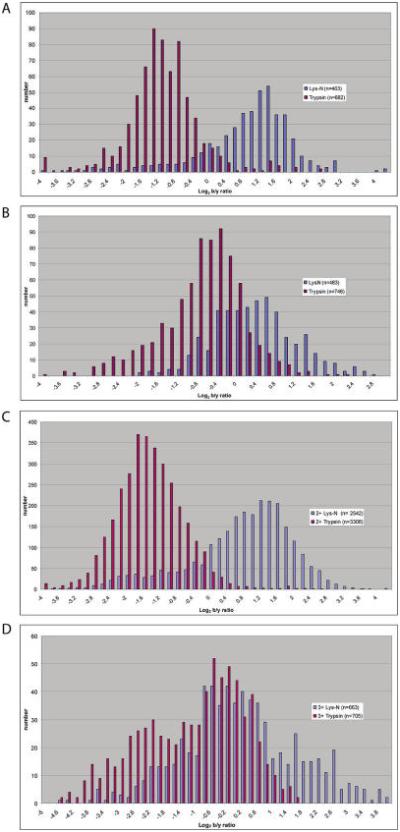
Distribution of b/y ratios with Lys-N and trypsin digestion is shown for analyses on an LTQ (A) and QSTAR (B) platform. In a biological replicate, a second sample of yeast was digested in parallel with Lys-N and trypsin and analyzed on an LTQ-Orbitrap. The distribution of b/y ratios is shown for doubly (C) and triply (D) charged peptides.