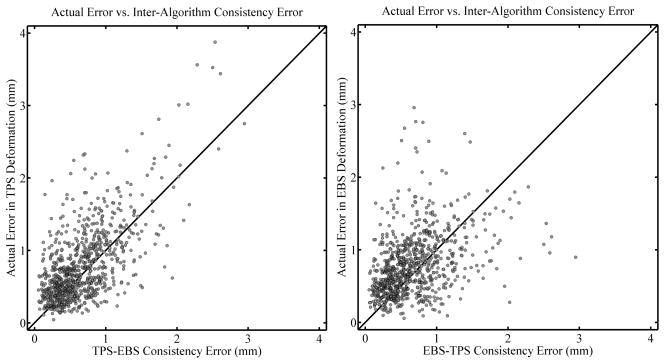
Figure 10.
Correlation plots comparing the actual error in TPS deformations (left panel) and EBS deformations (right panel) with the inter-algorithm consistency error. All deformation levels are combined (see text). Diagonal lines are drawn with a slope of 1 for reference and do not represent a fit of the data.

