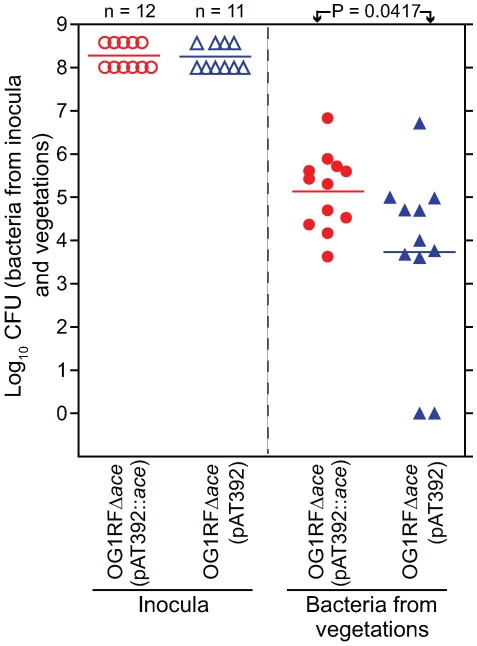
Figure 5. Complemented OG1RFΔace (pAT392::ace) [TX5647] and OG1RFΔace (pAT392) [TX5648] in early (mono-infection) colonization of aortic valves in the rat model.
In the panel on the left, empty circles and empty triangles represent OG1RFΔace (pAT392::ace) and OG1RFΔace (pAT392) inocula, respectively. In the panel on the right, solid circles and solid triangles represent OG1RFΔace (pAT392::ace) and OG1RFΔace (pAT392) in vegetations, respectively. Data are expressed as log10 CFU/gm recovered from the vegetations 4 h post infection of 12 rats (OG1RFΔace (pAT392::ace) and 11 rats (OG1RFΔace (pAT392), respectively. Horizontal bars represent the geometric mean titers. Significantly enhanced (by a mean ± SD increase of 1.4±0.6 log10 CFU/gm) vegetation titer by OG1RFΔace (pAT392::ace) versus OG1RFΔace (pAT392) (P = 0.0417) by unpaired t test for mean log10CFU/gm is shown.

