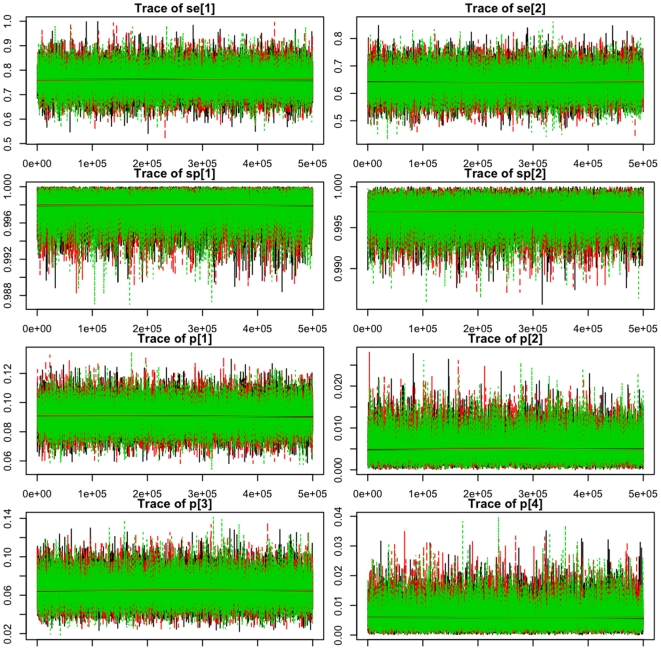
Figure 2. Trace plots.
MCMC history plots for each parameter of the Hui-Walter model for parameter estimates and true prevalence estimates for the T. brucei s.l. specific PCR (sensitivity = Se[1]; specificity = Sp[1]), T. brucei s.l. ITS-PCR (sensitivity = Se[2]; specificity = Sp[2]), cattle (p[1]), goats (p[2]), pigs (p[3]) and sheep (p[4]). The plots record every 10th sample from 500,000 iterations and the x axis is the sequence of iterations and the y axis the parameter value from that iteration.

