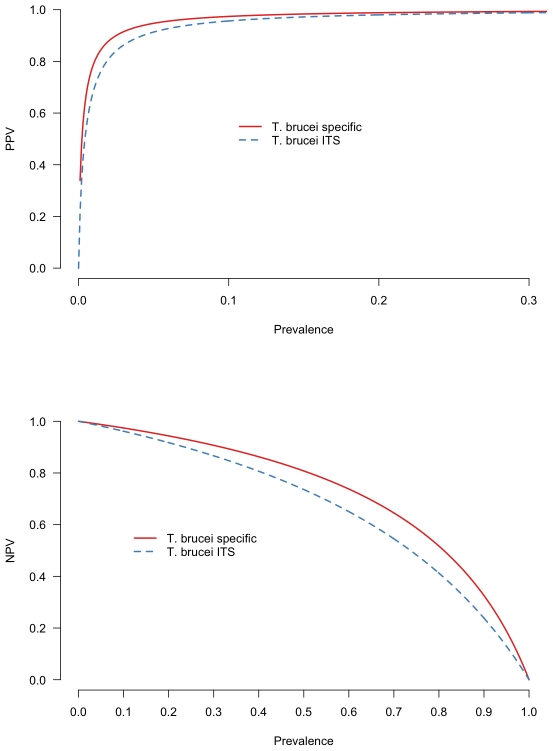
Figure 3. Predictive value plots.
The positive (PPV) and negative predictive value (NPV) of the T. brucei s.l. specific PCR and the ITS PCR over a range of prevalence of T. brucei s.l. PPV is the positive predictive value of the test at a given prevalence i.e. how likely the animal is to have the pathogen given that it has a positive test result. NPV is the negative predictive value of the test at a given prevalence i.e. how likely is an animal not to have the pathogen given that it had a negative test result.

