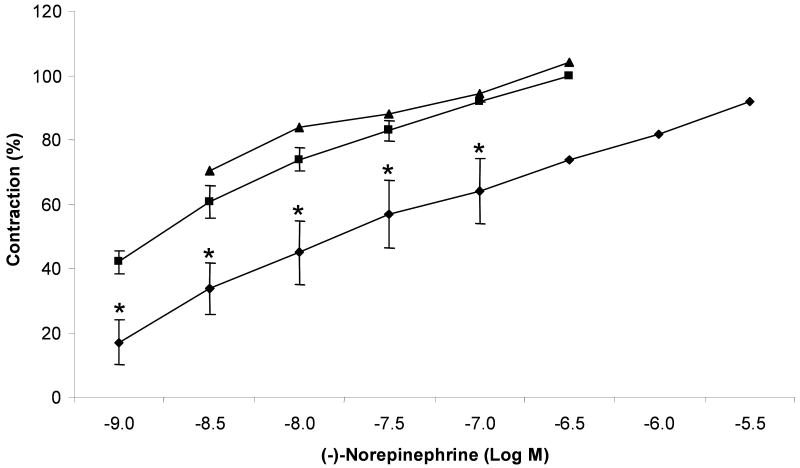
Figure 2.
Concentration response curves to (-)-norepinephrine (n = 2 to 4) obtained in control (■) or in the presence of (±)-pervilleine A HCl (n = 2 to 4) at a concentration of 100 μM (◆) and (±)-pervilleine H (n = 2) at 100 μM (▲). Results were expressed as mean ± SEM of experiments on the rat aorta ring. * p < 0.05, significant difference from the control groups.

