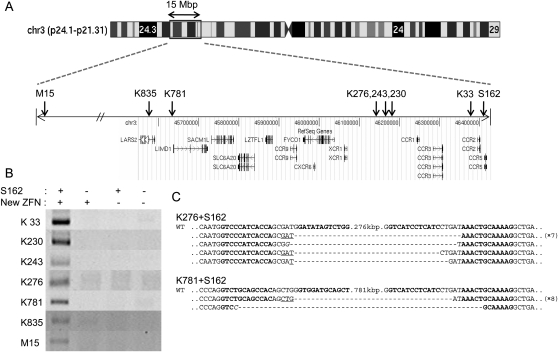
Figure 3.
Large nested genomic deletions. (A) ZFN target sites on a chromosomal ideogram. Arrows indicate the locations of ZFN target sites on the amplified view of the relevant chromosome 3 region. (B) PCR products validating large nested deletions. S162 and each of the seven new ZFNs were coexpressed in HEK 293 cells. DNA sequences of PCR primers used in this analysis are listed in Supplemental Table 3. (C) DNA sequences of PCR products corresponding to deletion events. Symbols are as in Figure 1.

