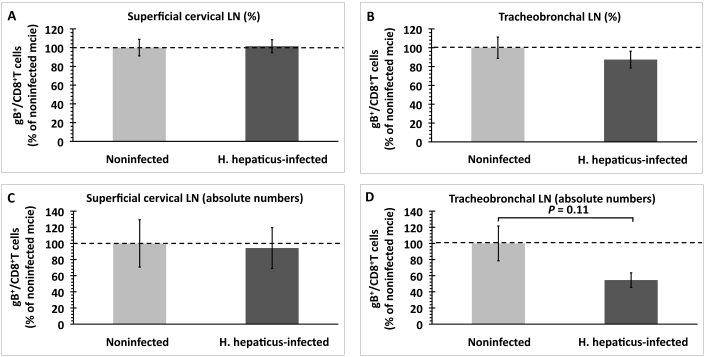
Figure 1.
Quantification of HSV1-specific CD8+ T cells in superficial cervical and tracheobronchal LN of H. hepaticus-infected and noninfected mice 1 wk after intranasal HSV1 infection. (A and B) Percentage of gB498–505-specific CD8+ T cells expressed in terms of total population of CD8+ T cells and (C and D) absolute numbers of gB498–505-specific CD8+ T cells. Data (mean ± SE) were normalized to the percentage or absolute number of gB498–505-specific CD8+ T cells in LN from noninfected mice within each experiment (n = 5 mice per group). Results were combined from 2 independent experiments. P value was determined by using the unpaired t test.

