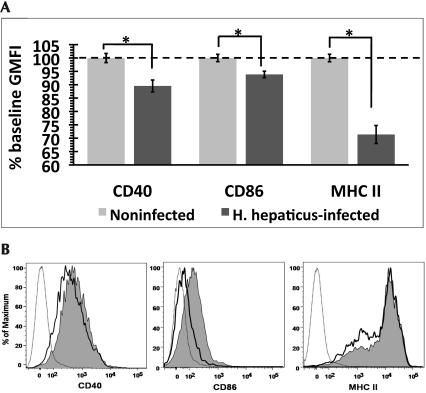
Figure 4.
Expression of maturation-associated surface markers on DC derived from colic LN. (A) Geometric mean (± SE) fluorescence intensity (GMFI) was normalized to the level of surface expression on DC from noninfected mice (% baseline GMFI) within each experiment (n = 5 to 6 mice per group). Results were combined from 3 independent experiments. (B) Representative histograms depicting the staining profile for surface markers on DC of H. hepaticus-infected (bold line) and noninfected (shaded area) mice. Dotted line represents unstained control. *, significant difference (P < 0.05) between indicated groups.

