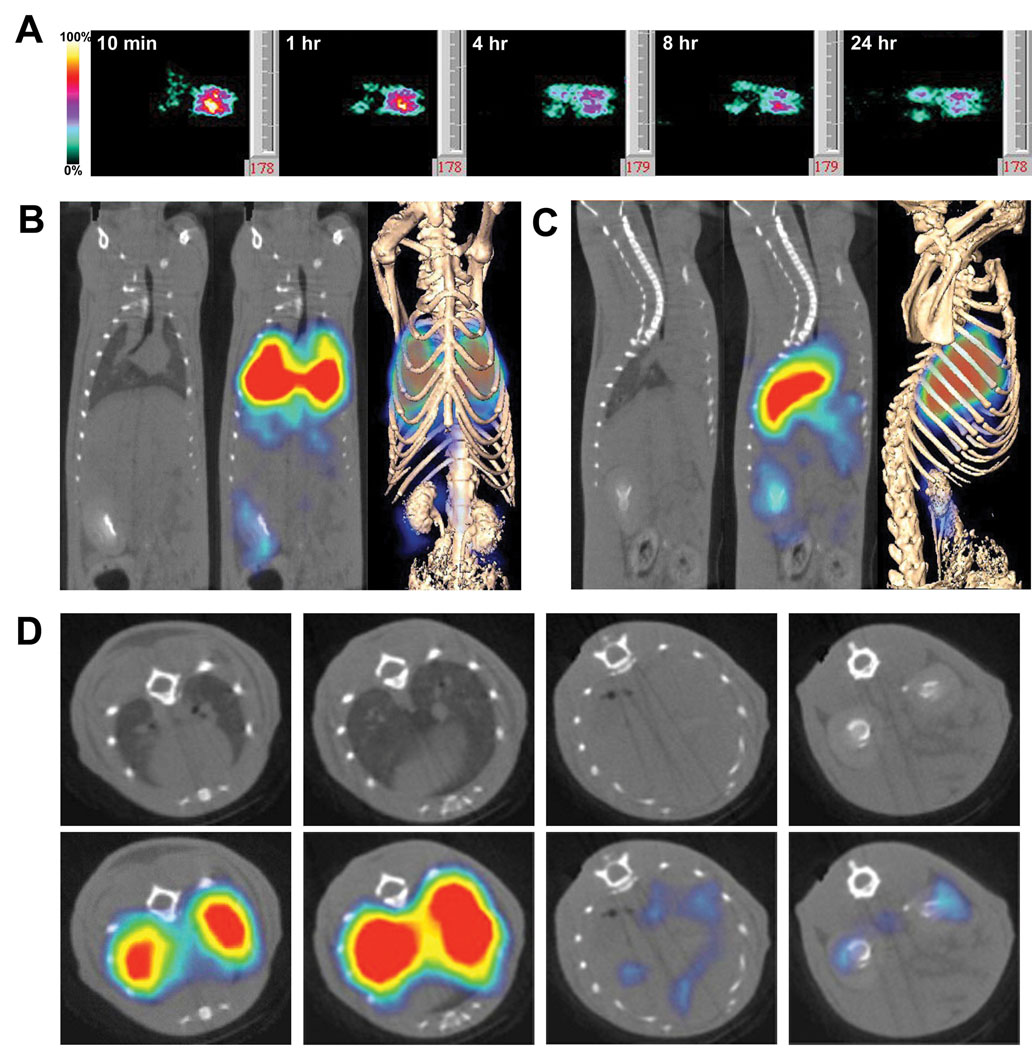
Figure 8.
In vivo imaging of organ immunotargeting. Rats were injected via the tail vein with 125I-G278 (10 µg at 10 µCi/ µg). Panel A: Planar γ-scintigraphic images were acquired at 10 min and at 1, 4, 8, and 24 hr. At 10 min the antibody has accumulated primarily in the lungs, but signals can also be seen in the areas of the liver and kidneys. Panels B, C & D: SPECT/CT imaging of G278 targeting showing coronal (B), saggital (C) and axial slices (D). The far right images in Panels B & C show the fusion of volumetric SPECT texture with the CT isosurface. Axial slices in D were taken at the level of the heart and lungs (far left), the lungs (second from left), the liver (third from left) and the kidneys (far right). Because of the high signal in lungs, the threshold is too low to see bound radiolabel in the heart.

