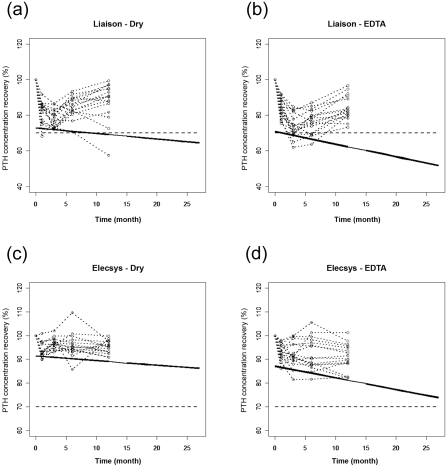
Figure 3.
Prediction of the linear degradation of PTH concentration over time for each pair of [“method”;”tube”]: (A) [Liaison; Dry]. (B) [Liaison; EDTA]. (C) [Elecsys; Dry]. (D) [Elecsys; EDTA]. The circles and the dotted lines show the evolution of the PTH recovery with respect to time point “0 mo.” The bold continuous lines are the lower 95% prediction limits and the dashed lines are the lower acceptance limits settled at 70% of recovery.

