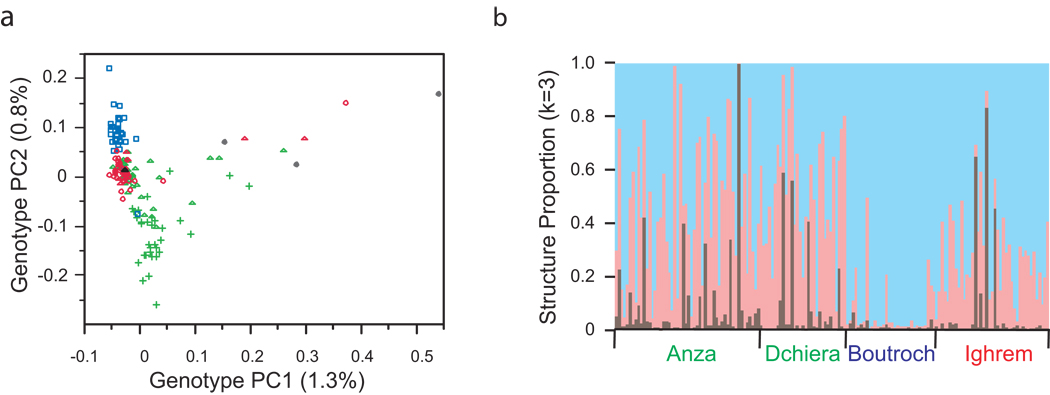
Figure 2. Population structure in southern Morocco.
(a)Eigenstrat principal component analysis of 579,144 SNPs reveals 7 significant eigenvectors, the first two of which, explaining just 1.3 and 0.8 % of the genotypic variance respectively, are plotted here. By self-report, Boutroch Amazigh are blue squares, Agadir Amazigh green triangles, Agadir Arabs green plus symbols, Ighrem Arabsred circles, and Ighrem Amazigh red triangles. 3 individuals with uncertain ethnicity possibly including sub-Saharan heritage, are indicated as gray spots, and have high values of PC1, which is characteristic of Yoruban ancestry as shown in Supplementary Figure 1b online. (b) Structure analysis of 16,000 autosomal SNPs, with k=3 and employing the admixture model with correlated allele frequencies, highlights the same individuals with large PC1 values (brown bars) and shows that Boutroch Amazigh are predominantly derived from one population group (pale blue) while all other samples are a mixture of the two populations represented by pale red and blue bars.

